the diagram represents a snapshot in time of a wave traveling through a slinky. use the background grid to…
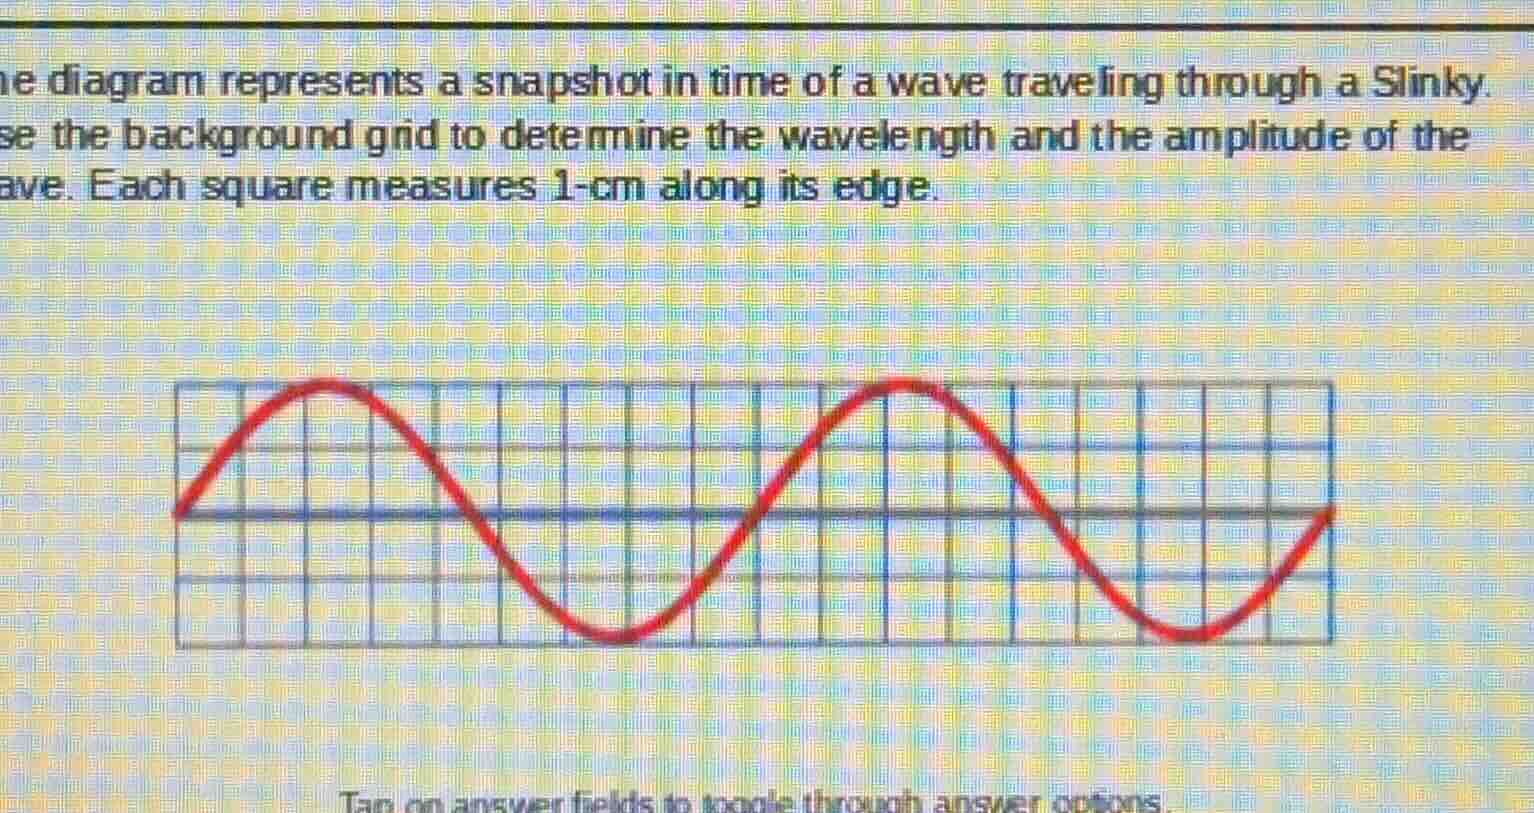
the diagram represents a snapshot in time of a wave traveling through a slinky. use the background grid to determine the wavelength and the amplitude of the wave. each square measures 1-cm along its edge.
Answer
Explanation:
Step1: Determinar la longitud de onda ($\lambda$)
Contar los cuadros entre dos crestas consecutivas en la cuadrícula. $$ \lambda = 8 \text{ cuadros} \times 1 \text{ cm/cuadro} = 8 \text{ cm} $$
Step2: Determinar la amplitud ($A$)
Medir la distancia vertical desde la línea central hasta una cresta. $$ A = 2 \text{ cuadros} \times 1 \text{ cm/cuadro} = 2 \text{ cm} $$
Answer:
Longitud de onda: 8 cm Amplitud: 2 cm