eleanor wants to show her class a comparison of melting rates between two different solids when heat is…
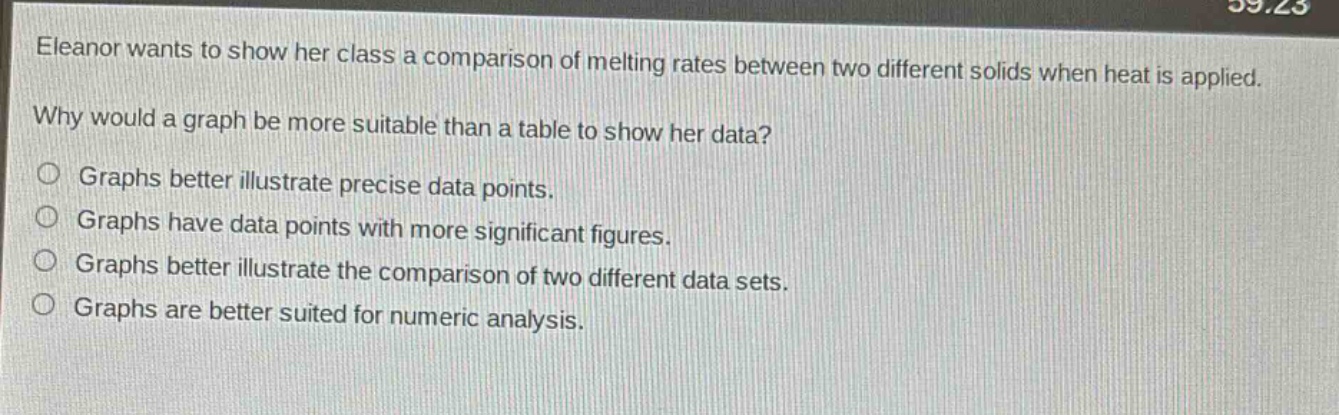
eleanor wants to show her class a comparison of melting rates between two different solids when heat is applied. why would a graph be more suitable than a table to show her data? graphs better illustrate precise data points. graphs have data points with more significant figures. graphs better illustrate the comparison of two different data sets. graphs are better suited for numeric analysis.
Answer
Brief Explanations:
Graphs visually compare datasets well. Tables are better for precise values and numeric analysis. Significant - figures are not related to graph - table choice here.
Answer:
Graphs better illustrate the comparison of two different data sets.