eriks physics class is outside testing the miniature rockets they built. erik sets his rocket on the ground…
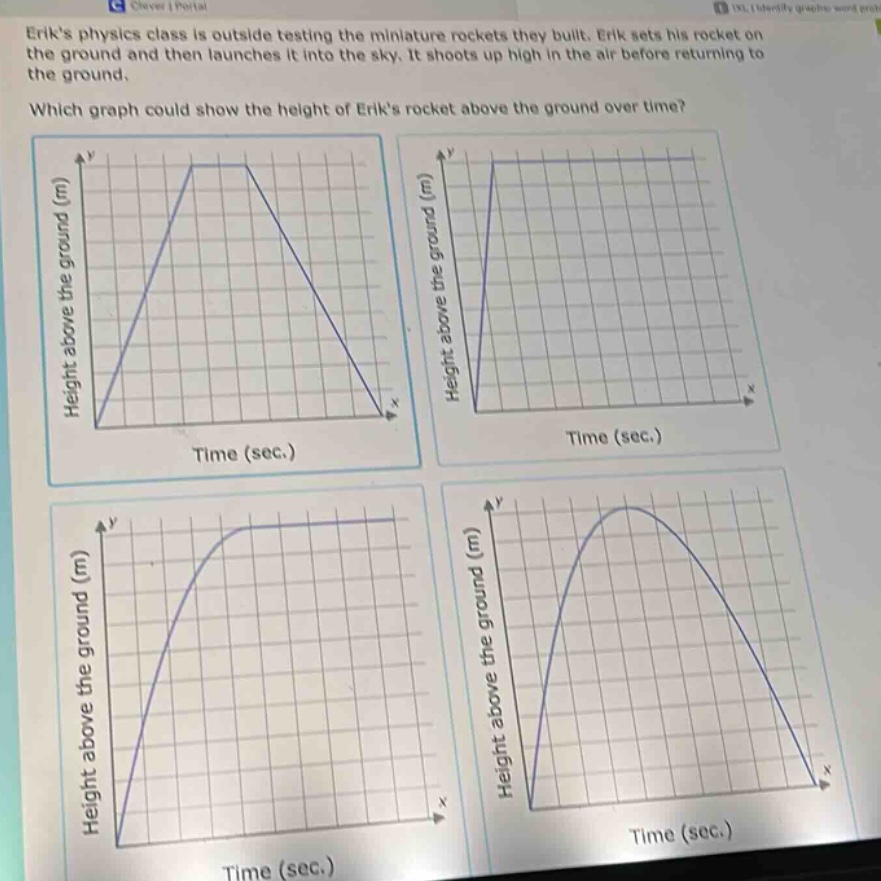
eriks physics class is outside testing the miniature rockets they built. erik sets his rocket on the ground and then launches it into the sky. it shoots up high in the air before returning to the ground. which graph could show the height of eriks rocket above the ground over time?
Answer
Answer:
The bottom - right graph.
Explanation:
Step1: Analyze rocket motion
The rocket starts on the ground (height = 0), then accelerates upwards so height increases with time. As it goes up, gravity causes it to decelerate until it reaches a maximum height (where the slope of the height - time graph is 0). Then it starts to fall back down due to gravity, and the height decreases until it reaches the ground again (height = 0). This motion is represented by a parabolic - like curve, which is shown in the bottom - right graph.