in an experiment, the motion data for a toy truck was recorded in the position - time graph. which statement…
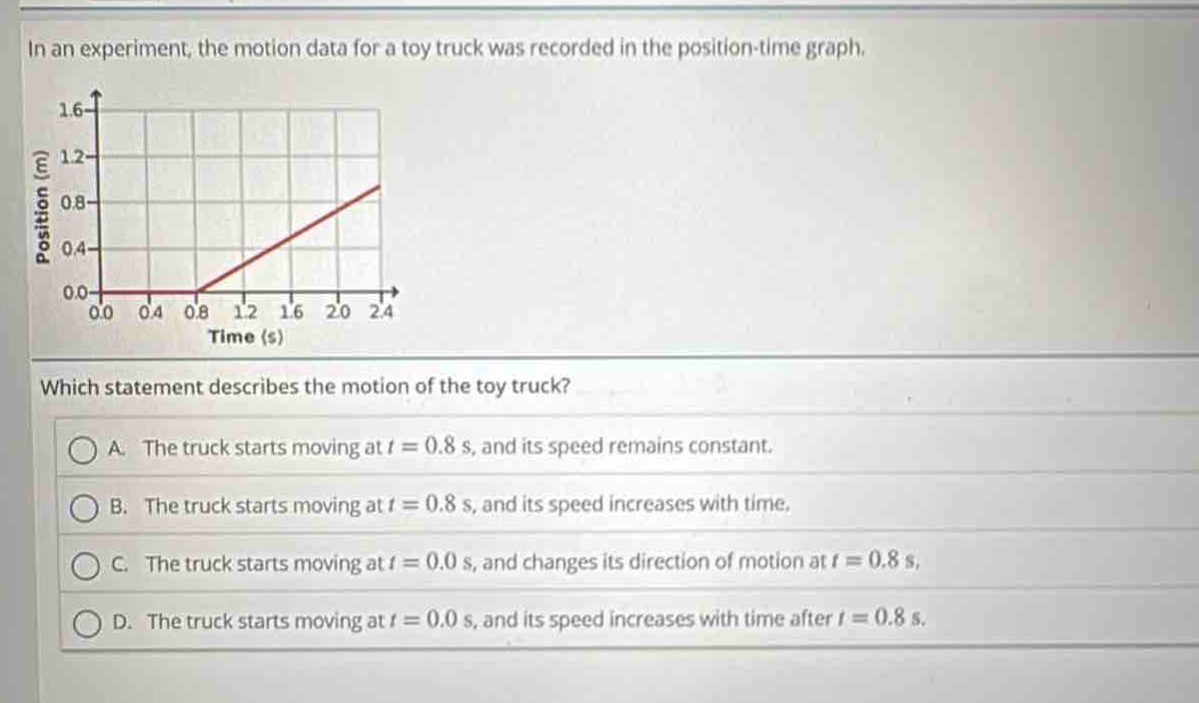
in an experiment, the motion data for a toy truck was recorded in the position - time graph. which statement describes the motion of the toy truck? a. the truck starts moving at t = 0.8 s, and its speed remains constant. b. the truck starts moving at t = 0.8 s, and its speed increases with time. c. the truck starts moving at t = 0.0 s, and changes its direction of motion at t = 0.8 s. d. the truck starts moving at t = 0.0 s, and its speed increases with time after t = 0.8 s.
Answer
Brief Explanations:
In a position - time graph, a horizontal line means the object is at rest. The graph shows the toy truck is at rest from (t = 0) s to (t=0.8) s. After (t = 0.8) s, the graph is a straight line, which represents a constant - speed motion (since the slope of a position - time graph gives the speed and a straight line has a constant slope).
Answer:
A. The truck starts moving at (t = 0.8) s, and its speed remains constant.