an experiment is set up using a hanging mass to pull a cart along a horizontal track. a light string is…
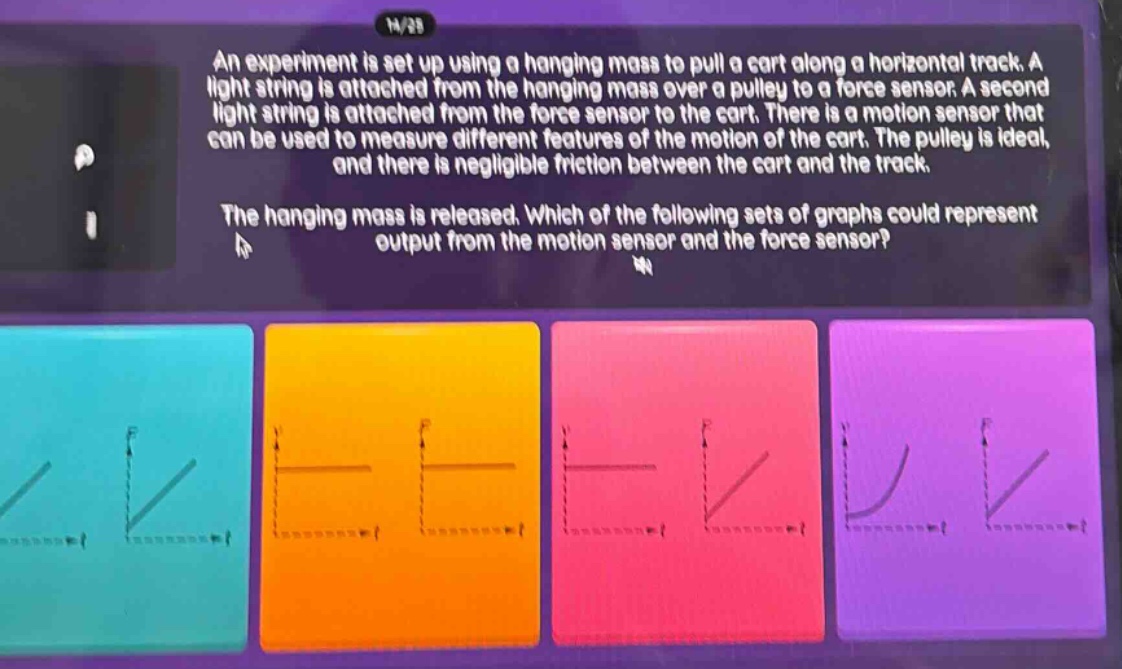
an experiment is set up using a hanging mass to pull a cart along a horizontal track. a light string is attached from the hanging mass over a pulley to a force sensor. a second light string is attached from the force sensor to the cart. there is a motion sensor that can be used to measure different features of the motion of the cart. the pulley is ideal, and there is negligible friction between the cart and the track. the hanging mass is released. which of the following sets of graphs could represent output from the motion sensor and the force sensor?
Answer
Explanation:
Step1: Analyze the motion of the cart
The hanging - mass system causes the cart to move with a constant acceleration. According to Newton's second law $F = ma$. The force sensor measures the tension in the string. Since the system has a constant acceleration $a=\frac{mg}{M + m}$ (where $m$ is the hanging mass, $M$ is the mass of the cart), the tension $T$ in the string is constant ($T = Ma=\frac{Mmg}{M + m}$). So the force - sensor graph should be a horizontal line.
Step2: Analyze the motion - sensor output
The motion sensor can measure velocity or position. If it measures velocity, since $v=v_0+at$ (with $v_0 = 0$ as the cart starts from rest), the velocity - time graph is a straight line with a non - zero slope (because $a$ is constant). If it measures position, since $x=x_0+v_0t+\frac{1}{2}at^2$ (with $x_0 = 0$ and $v_0 = 0$), the position - time graph is a parabola. But if we assume the motion sensor measures velocity, the velocity of the cart increases linearly with time.
Answer:
The set of graphs where the force - sensor graph is a horizontal line and the motion - sensor graph (assuming velocity measurement) is a straight line with a non - zero slope. Without specific labels on the graphs in the options, we can't point out a specific color - coded option, but the general form of the correct graphs is as described above.