on a given day, the temperature in a pool increases with both the work of a heater modeled by the function…
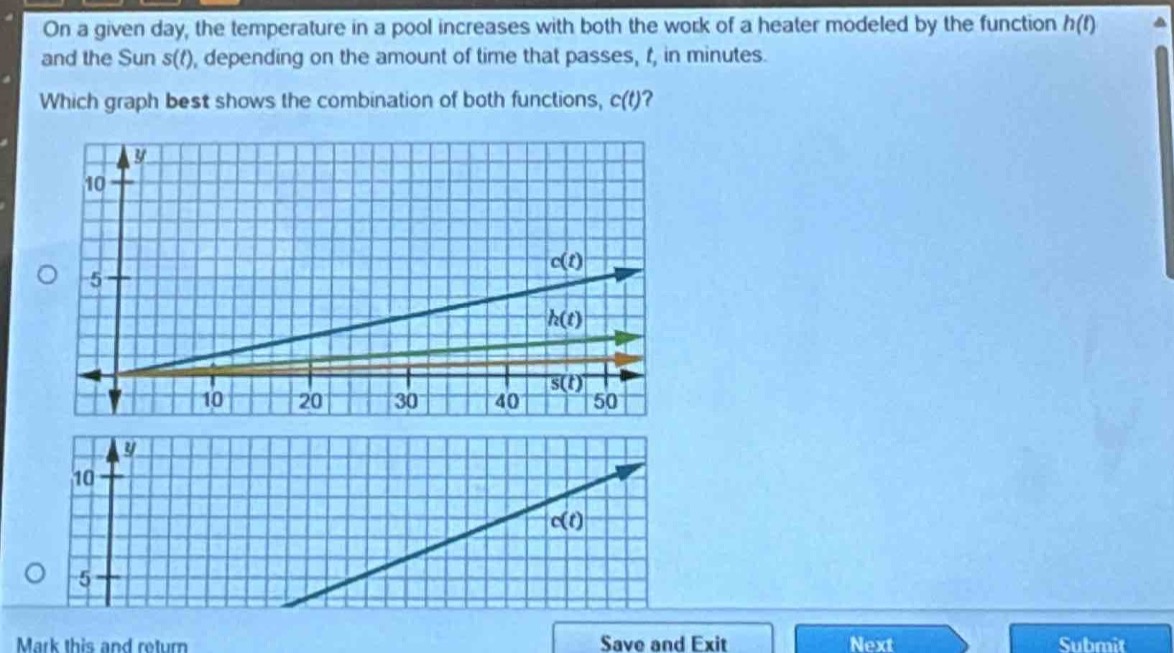
on a given day, the temperature in a pool increases with both the work of a heater modeled by the function h(t) and the sun s(t), depending on the amount of time that passes, t, in minutes. which graph best shows the combination of both functions, c(t)?
Answer
Explanation:
Step1: Understand function combination
The combined function $c(t)=h(t)+s(t)$. Since both $h(t)$ and $s(t)$ contribute to the increase in temperature, the graph of $c(t)$ should have a steeper slope than either $h(t)$ or $s(t)$ alone.
Step2: Analyze first - graph
In the first graph, the slope of $c(t)$ is greater than the slopes of $h(t)$ and $s(t)$ which is consistent with $c(t)=h(t) + s(t)$. The function $c(t)$ starts from the origin (assuming initial temperature is 0 when $t = 0$) and increases at a rate that is the sum of the rates of $h(t)$ and $s(t)$.
Step3: Analyze second - graph
The second graph only shows the function $c(t)$ and no indication of $h(t)$ and $s(t)$ and also does not show the combined - effect relationship properly as it does not compare the slopes with the individual functions.
Answer:
The first graph best shows the combination of both functions $c(t)$.