which graph best demonstrates the general relationship between mass and temperature, similar to the trend of…
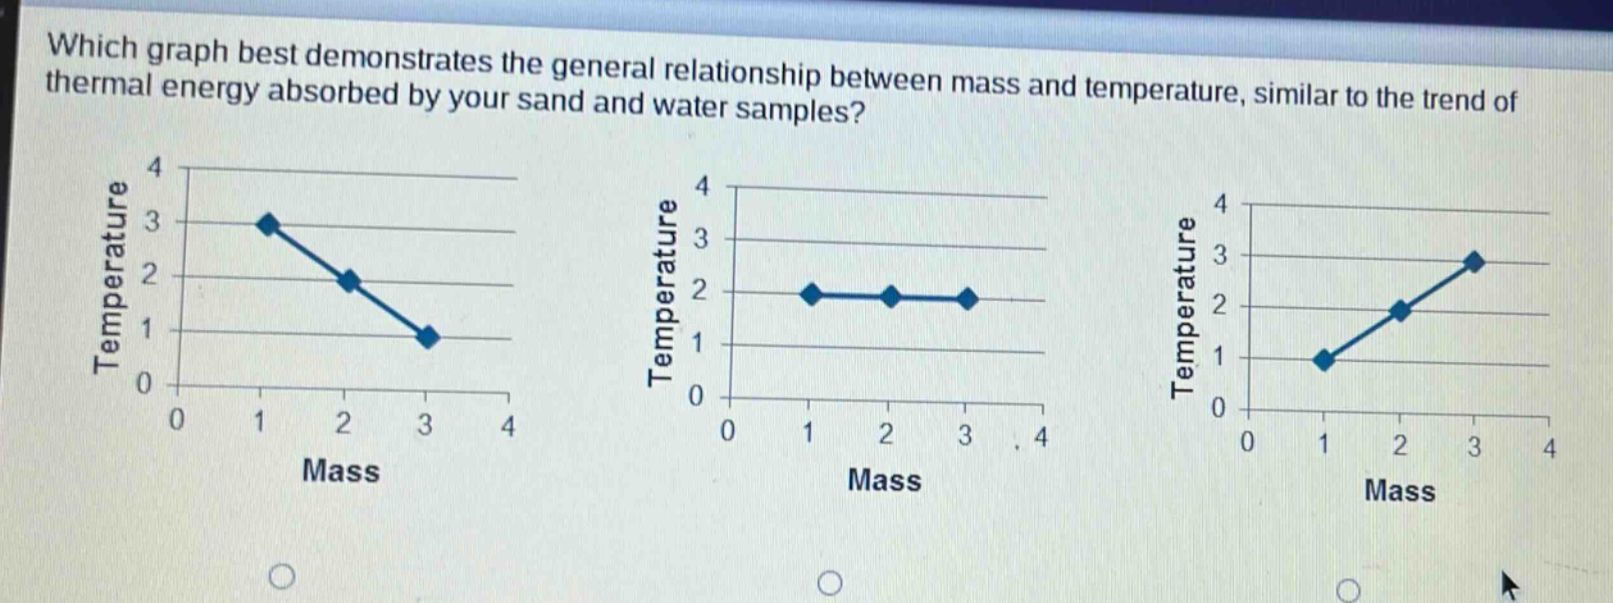
which graph best demonstrates the general relationship between mass and temperature, similar to the trend of thermal energy absorbed by your sand and water samples?
Answer
Explanation:
Step1: Recall heat - energy formula
The heat - energy formula is $Q = mc\Delta T$, where $Q$ is the thermal energy absorbed, $m$ is the mass, $c$ is the specific heat capacity, and $\Delta T$ is the change in temperature. Assuming the same amount of thermal energy $Q$ is absorbed and the same substance (constant $c$), we can rewrite the formula for $\Delta T$ as $\Delta T=\frac{Q}{mc}$. So, $\Delta T$ is inversely proportional to $m$ (when $Q$ and $c$ are constant).
Step2: Analyze graph trends
An inverse - proportional relationship means that as the mass $m$ increases, the temperature $\Delta T$ decreases. The first graph shows a decreasing trend of temperature with an increase in mass, which is consistent with the inverse - proportional relationship. The second graph shows a constant temperature with an increase in mass, and the third graph shows an increasing temperature with an increase in mass.
Answer:
The first graph (the one with a decreasing trend of temperature as mass increases)