which graph best represents the relationship between ke and mass? ke mass ke mass ke mass ke mass
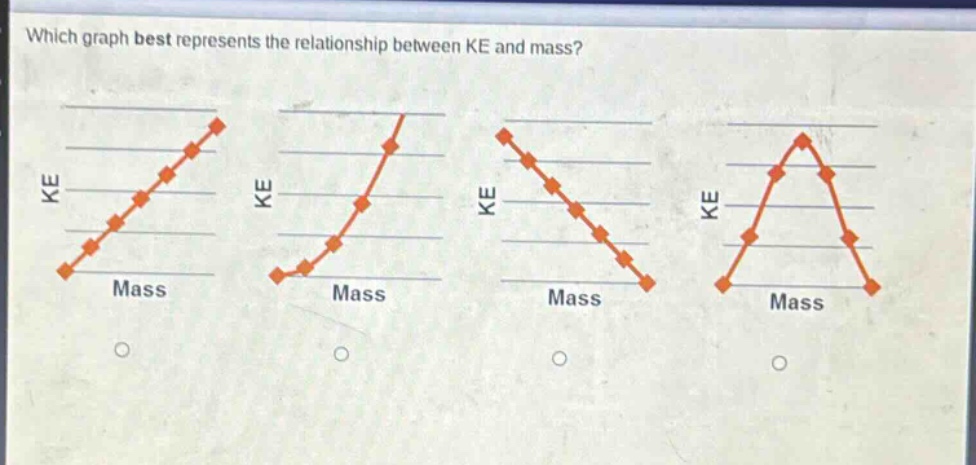
which graph best represents the relationship between ke and mass? ke mass ke mass ke mass ke mass
Answer
Explanation:
Step1: Recall kinetic - energy formula
The formula for kinetic energy is $KE=\frac{1}{2}mv^{2}$, where $v$ is the velocity and $m$ is the mass. Assuming the velocity $v$ is constant, $KE$ is directly proportional to $m$.
Step2: Analyze the graph of a direct - proportion
The graph of a direct - proportion between two variables $y$ and $x$ is a straight line passing through the origin ($y = kx$, where $k$ is a non - zero constant). In the case of $KE=\frac{1}{2}v^{2}m$ (with $v$ constant), $KE$ is a linear function of $m$ with a positive slope.
Answer:
The first graph (the straight - line graph with a positive slope starting from the origin)