which graph best represents the relationship between ke and speed? ke speed ke speed ke speed ke speed
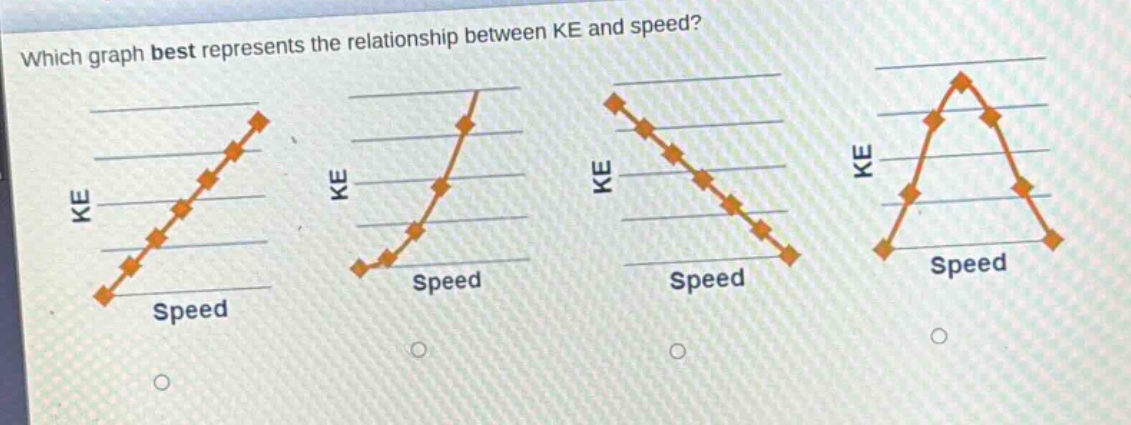
which graph best represents the relationship between ke and speed? ke speed ke speed ke speed ke speed
Answer
Explanation:
Step1: Recall kinetic - energy formula
The kinetic - energy formula is $KE=\frac{1}{2}mv^{2}$, where $m$ is the mass of the object and $v$ is the speed. Since mass $m$ is a non - zero constant for a given object, $KE$ is a quadratic function of $v$.
Step2: Analyze the form of the quadratic function
The general form of a quadratic function $y = ax^{2}+bx + c$ (in our case, $y = KE$, $x = v$, $a=\frac{1}{2}m$, $b = 0$, $c = 0$). A quadratic function $y=ax^{2}$ with $a>0$ has a parabolic shape opening upwards. When $v = 0$, $KE=0$, and as $v$ increases (either in the positive or negative direction), $KE$ increases.
Answer:
The graph that is a parabolic curve opening upwards (the second graph from the left) best represents the relationship between $KE$ and speed.