which graph best represents the relationship between volume and pressure? pressure volume pressure volume…
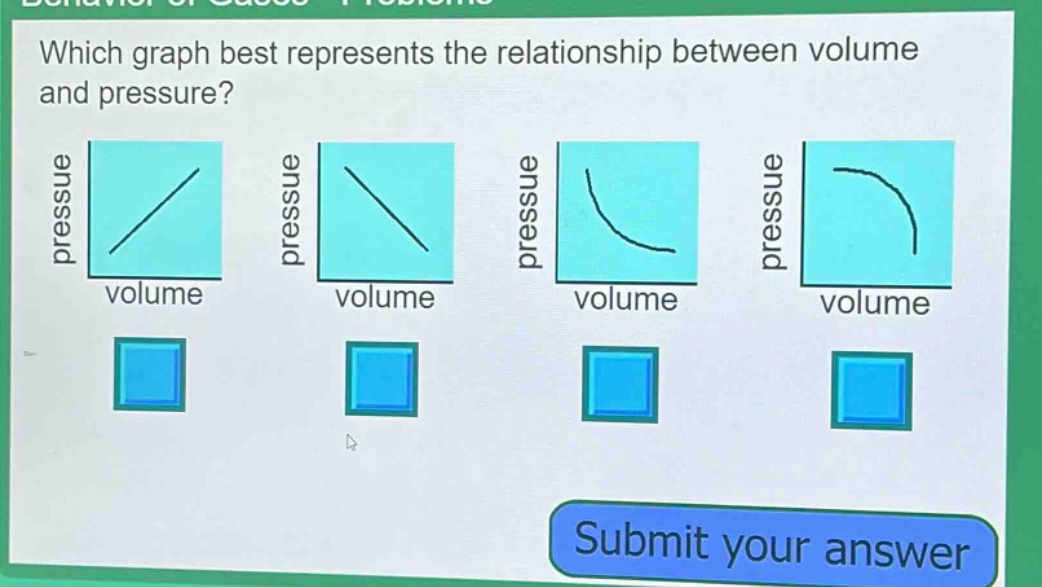
which graph best represents the relationship between volume and pressure? pressure volume pressure volume pressure volume pressure volume submit your answer
Answer
Explanation:
Step1: Recall Boyle's law
Boyle's law states that for a given mass of gas at constant temperature, pressure $P$ and volume $V$ are inversely - proportional, i.e., $PV = k$ (where $k$ is a constant).
Step2: Analyze the graph shape
The equation $PV=k$ can be rewritten as $P=\frac{k}{V}$. The graph of a function of the form $y = \frac{a}{x}$ (where $a$ is a non - zero constant) is a hyperbola. When $x$ (volume) increases, $y$ (pressure) decreases and vice - versa.
Answer:
The graph with a curved line sloping downwards from left to right (the third graph from the left) best represents the relationship between volume and pressure.