which graph correctly depicts the relationship between pressure and volume when temperature and number of…
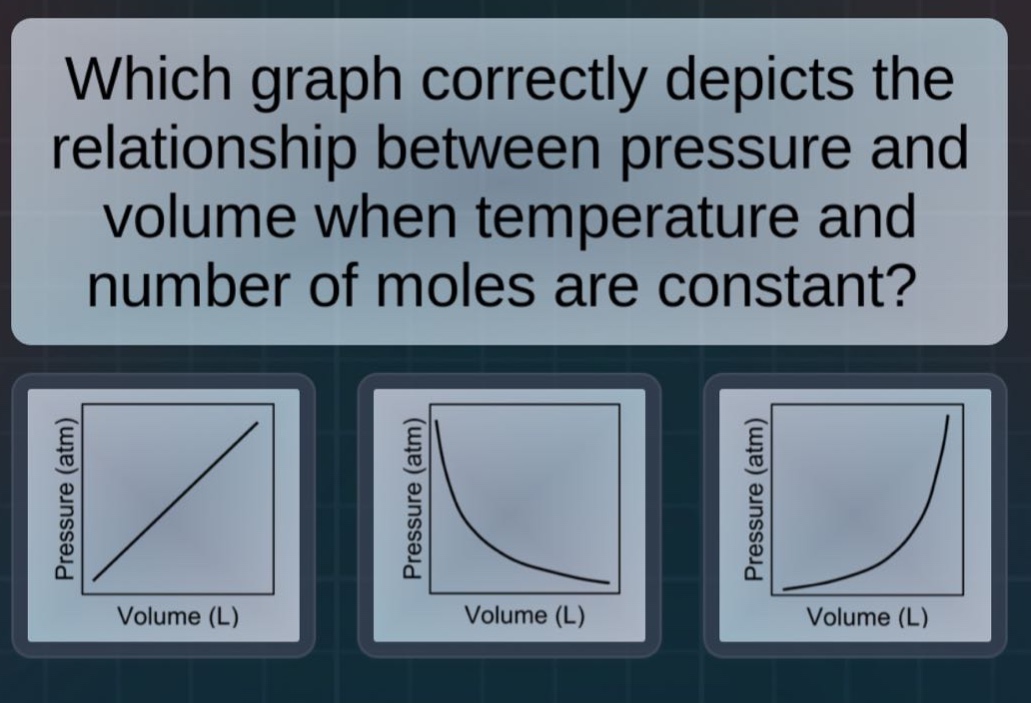
which graph correctly depicts the relationship between pressure and volume when temperature and number of moles are constant?
Answer
Explanation:
Step1: Recall Boyle's law
Boyle's law states that $P_1V_1 = P_2V_2$ (when $T$ and $n$ are constant), which means $P$ and $V$ are inversely - proportional.
Step2: Analyze the graph shapes
An inverse - proportional relationship is represented by a hyperbola. A direct - proportional relationship is a straight line through the origin, and a non - linear increasing relationship is not an inverse proportion.
Answer:
The second graph (the one with a hyperbolic shape showing an inverse relationship between pressure and volume) correctly depicts the relationship.