the graph depicts the velocity and times of elan and anna during a race. which best depicts the data? from 0…
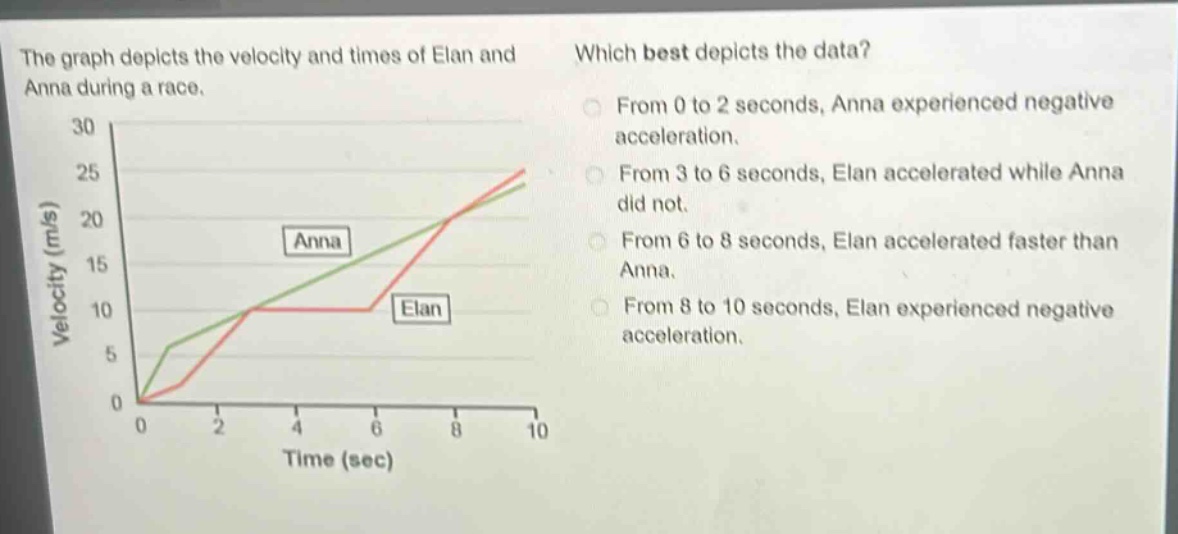
the graph depicts the velocity and times of elan and anna during a race. which best depicts the data? from 0 to 2 seconds, anna experienced negative acceleration. from 3 to 6 seconds, elan accelerated while anna did not. from 6 to 8 seconds, elan accelerated faster than anna. from 8 to 10 seconds, elan experienced negative acceleration.
Answer
Explanation:
Step1: Recall acceleration - velocity relationship
Acceleration is the rate of change of velocity. A positive - sloped velocity - time graph indicates positive acceleration, a negative - sloped graph indicates negative acceleration, and a horizontal graph indicates zero acceleration.
Step2: Analyze 0 - 2 seconds
For Anna from 0 to 2 seconds, the velocity - time graph has a positive slope, so she has positive acceleration, not negative.
Step3: Analyze 3 - 6 seconds
For Elan from 3 to 6 seconds, the velocity - time graph is horizontal, so his acceleration is 0. For Anna, the graph is also horizontal, so her acceleration is 0. So, it is incorrect to say Elan accelerated while Anna did not.
Step4: Analyze 6 - 8 seconds
For Elan from 6 to 8 seconds, the slope of his velocity - time graph is steeper than Anna's. Since the slope of the velocity - time graph represents acceleration, Elan accelerated faster than Anna in this time interval.
Step5: Analyze 8 - 10 seconds
For Elan from 8 to 10 seconds, the velocity - time graph has a positive slope, so he has positive acceleration, not negative.
Answer:
From 6 to 8 seconds, Elan accelerated faster than Anna.