the graph indicates lindas walk. which best describes the graph? linda started out moving, and then stopped…
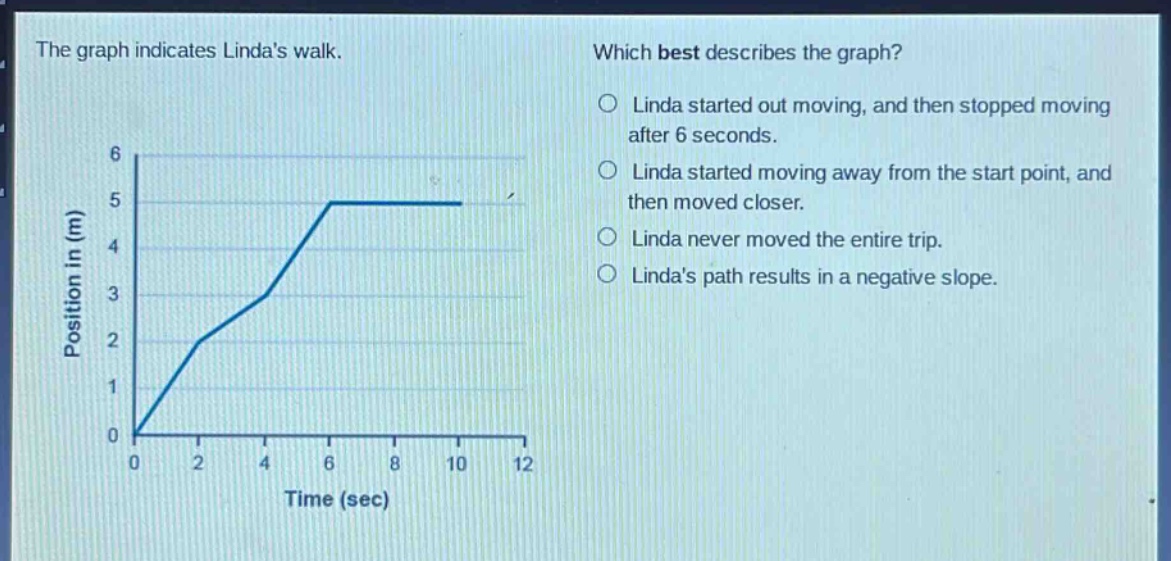
the graph indicates lindas walk. which best describes the graph? linda started out moving, and then stopped moving after 6 seconds. linda started moving away from the start point, and then moved closer. linda never moved the entire trip. lindas path results in a negative slope.
Answer
Explanation:
Step1: Analyze the graph
The position - time graph starts from the origin (0,0) and the position increases with time until (t = 6) seconds. After (t=6) seconds, the position remains constant.
Step2: Evaluate each option
- Option 1: Linda started out moving, and then stopped moving after 6 seconds. This is correct as the position - time graph has a non - zero slope (indicating motion) until (t = 6) seconds and then a zero slope (indicating no motion) after (t = 6) seconds.
- Option 2: The graph shows that Linda moves away from the start point but does not move closer as the position does not decrease.
- Option 3: Linda did move as the position changed from (t=0) to (t = 6) seconds.
- Option 4: The slope is positive until (t = 6) seconds and zero after (t=6) seconds, not negative.
Answer:
Linda started out moving, and then stopped moving after 6 seconds.