the graph indicates what about the relationship between wavelength and frequency? a as wavelength decreases…
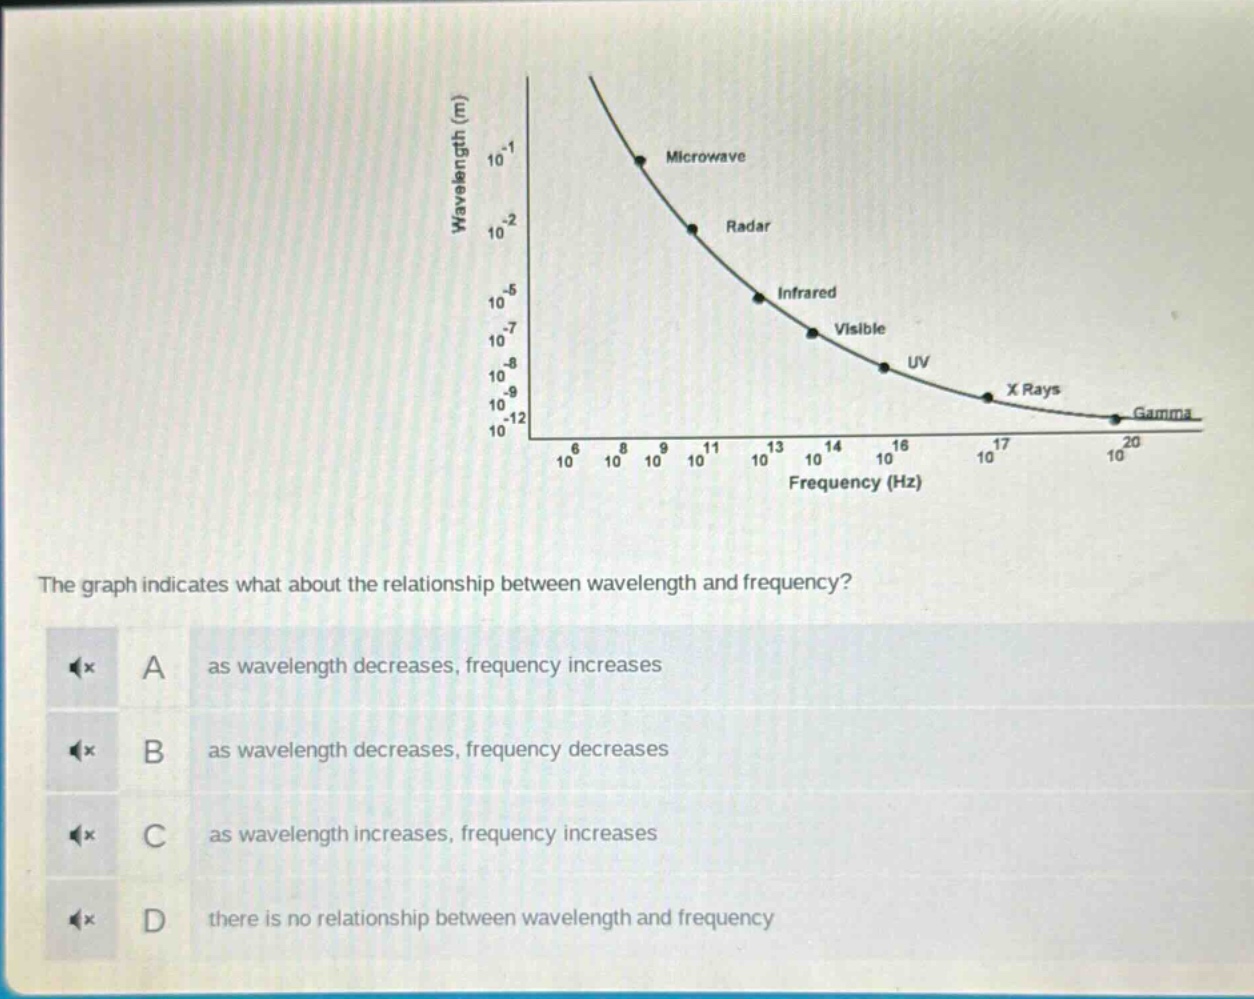
the graph indicates what about the relationship between wavelength and frequency? a as wavelength decreases, frequency increases b as wavelength decreases, frequency decreases c as wavelength increases, frequency increases d there is no relationship between wavelength and frequency
Answer
Brief Explanations:
By observing the graph, as the value of wavelength on the y - axis decreases from top to bottom, the value of frequency on the x - axis increases from left to right. This shows an inverse relationship between wavelength and frequency.
Answer:
A. as wavelength decreases, frequency increases