graph the planet data, shown right, using the regression calculator. when you are done, click “resize window…
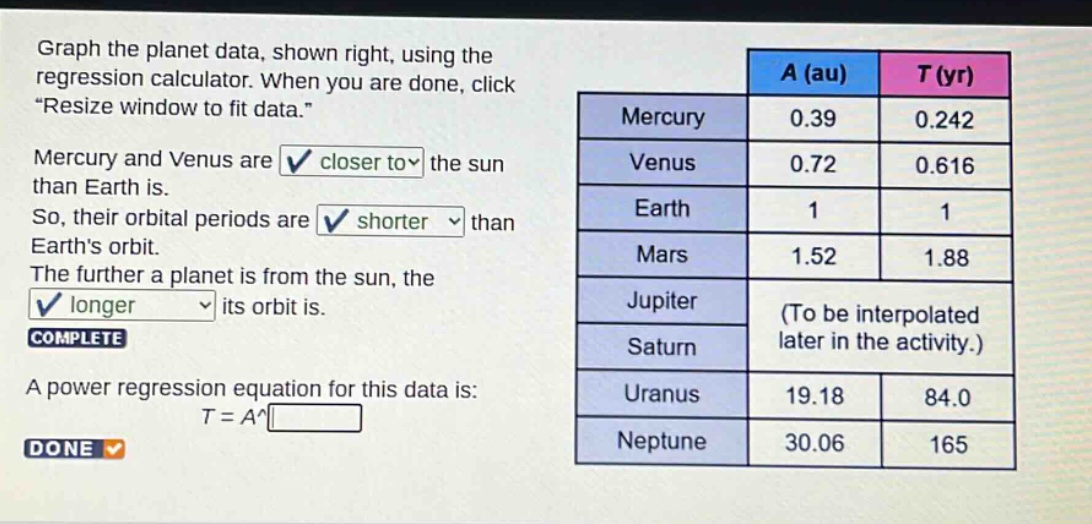
graph the planet data, shown right, using the regression calculator. when you are done, click “resize window to fit data.” mercury and venus are closer to the sun than earth is. so, their orbital periods are shorter than earth’s orbit. the further a planet is from the sun, the longer its orbit is. complete a power regression equation for this data is: t = a^ done
Answer
Explanation:
Step1: Recall power - regression form
The general power - regression equation is $y = ax^{b}$. In our case, $T = aA^{b}$. For the solar - system data, when $A = 1$ (Earth), $T = 1$. Substituting these values into $T=aA^{b}$, we get $1=a\times1^{b}$, so $a = 1$.
Step2: Use another data - point
Let's use the data for Mars. $A = 1.52$ and $T = 1.88$. Since $T = A^{b}$, then $1.88=(1.52)^{b}$. Take the natural logarithm of both sides: $\ln(1.88)=b\ln(1.52)$.
Step3: Solve for $b$
$b=\frac{\ln(1.88)}{\ln(1.52)}$. $\ln(1.88)\approx0.631$ and $\ln(1.52)\approx0.418$. $b=\frac{0.631}{0.418}\approx1.5$.
Answer:
$1.5$