which graph represents a car with negative acceleration?
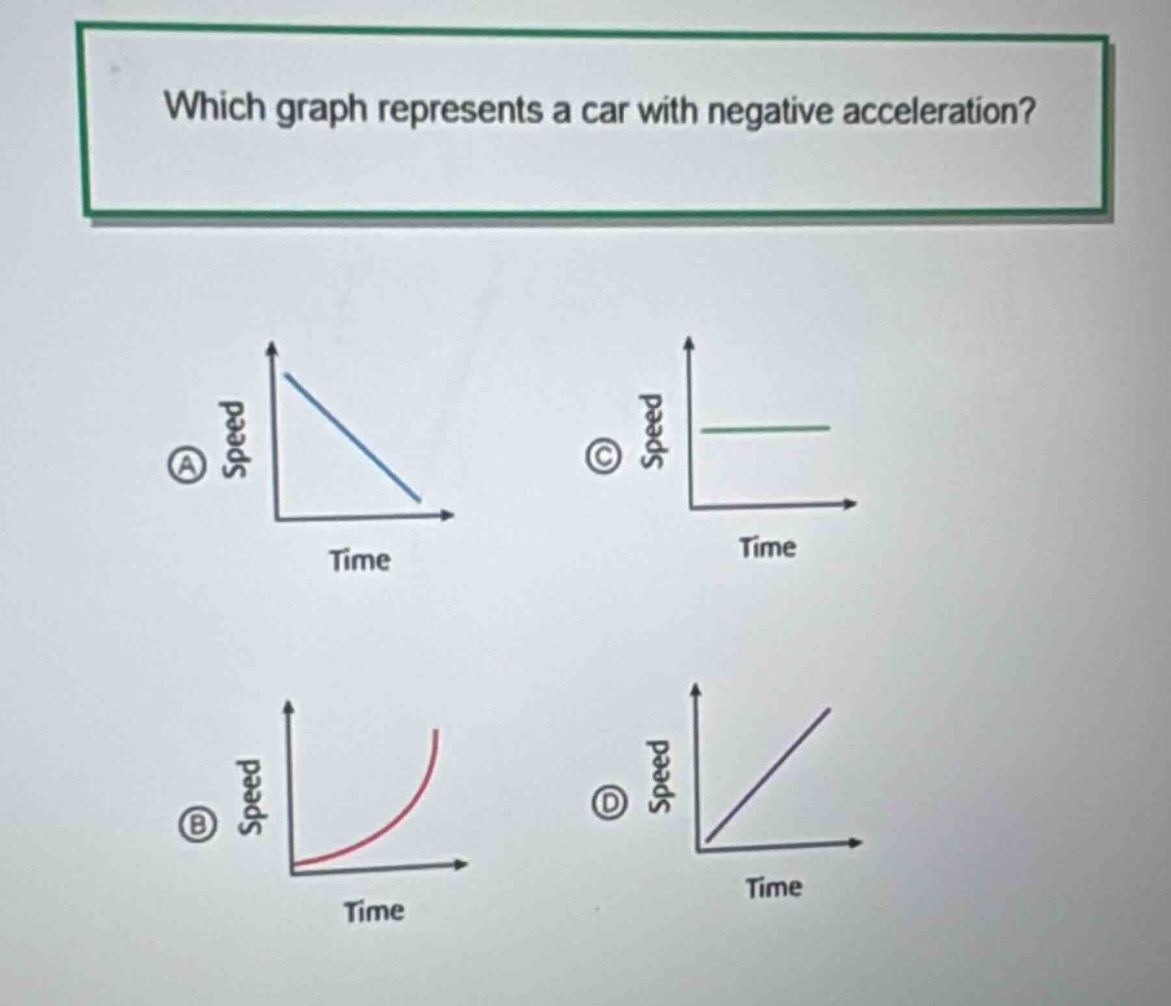
which graph represents a car with negative acceleration?
Answer
Explanation:
Step1: Recall acceleration - speed relation
Acceleration is the rate of change of speed. Negative acceleration means speed is decreasing over time.
Step2: Analyze each graph
- In graph A, speed decreases as time increases.
- In graph B, speed increases with time (positive acceleration).
- In graph C, speed is constant (acceleration = 0).
- In graph D, speed increases linearly with time (positive acceleration).
Answer:
A.