the graph below represents the distance of a dog from a trainer after a command is given. which statement…
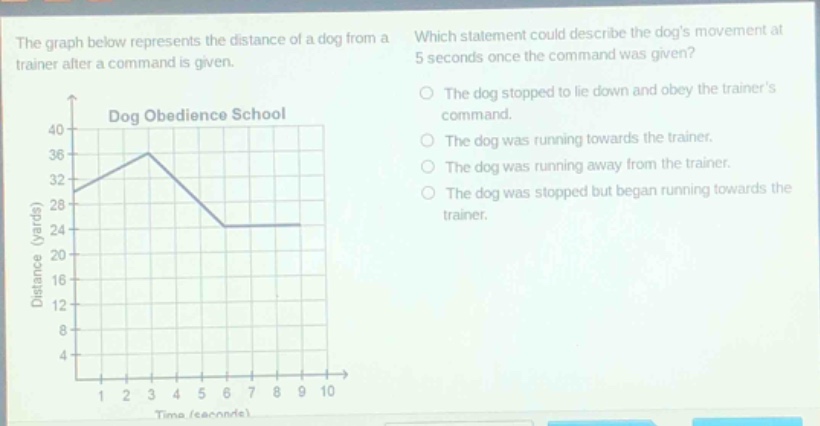
the graph below represents the distance of a dog from a trainer after a command is given. which statement could describe the dogs movement at 5 seconds once the command was given? dog obedience school distance (yards) 40 36 32 28 24 20 16 12 8 4 1 2 3 4 5 6 7 8 9 10 time (seconds) the dog stopped to lie down and obey the trainers command. the dog was running towards the trainer. the dog was running away from the trainer. the dog was stopped but began running towards the trainer.
Answer
Brief Explanations:
At 5 seconds, the distance - time graph shows a horizontal line segment for the dog's motion after the initial change in distance. A horizontal line on a distance - time graph means the distance of the dog from the trainer is not changing, which implies the dog has stopped moving.
Answer:
The dog stopped to lie down and obey the trainer's command.