the graph represents the function where electricity usage in kilowatts per hour of a clock radio varies…
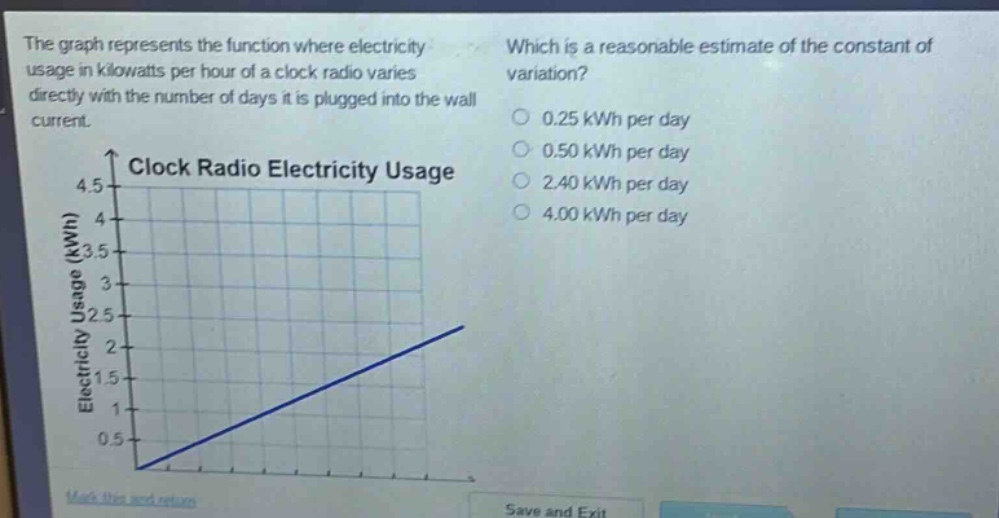
the graph represents the function where electricity usage in kilowatts per hour of a clock radio varies directly with the number of days it is plugged into the wall current. which is a reasonable estimate of the constant of variation? 0.25 kwh per day 0.50 kwh per day 2.40 kwh per day 4.00 kwh per day clock radio electricity usage
Answer
Answer:
0.25 kWh per day
Explanation:
Step1: Recall direct - variation formula
The formula for direct variation is $y = kx$, where $k$ is the constant of variation. In this case, $y$ is electricity usage in kWh and $x$ is the number of days.
Step2: Select two points on the line
Let's assume the line passes through the points $(0,0)$ and $(4,1)$.
Step3: Calculate the constant of variation
$k=\frac{y_2 - y_1}{x_2 - x_1}=\frac{1 - 0}{4 - 0}=\frac{1}{4}=0.25$ kWh per day.