this graph represents the motion of a vehicle. when was the vehicle stationary? from 0 s to 20 s from 20 s…
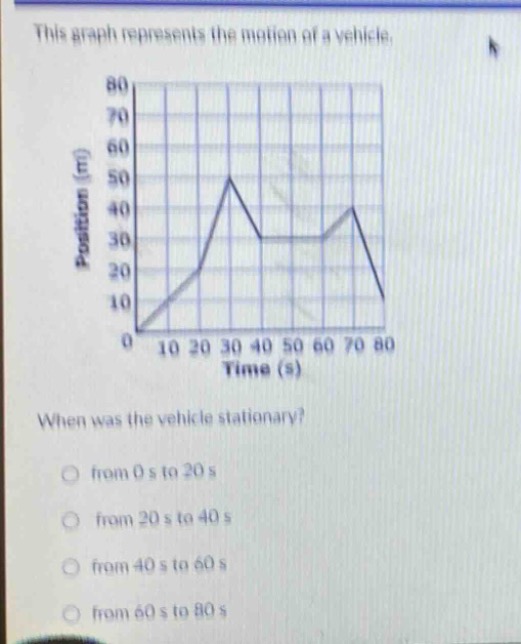
this graph represents the motion of a vehicle. when was the vehicle stationary? from 0 s to 20 s from 20 s to 40 s from 40 s to 60 s from 60 s to 80 s
Answer
Explanation:
Step1: Understand stationary motion
A vehicle is stationary when its position does not change with time. On a position - time graph, this is represented by a horizontal line.
Step2: Analyze the graph
Looking at the given position - time graph, the horizontal part of the graph is from 40 s to 60 s. During this time interval, the position of the vehicle remains constant at 30 m.
Answer:
from 40 s to 60 s