the graph represents the sea - level heating curve of water. how would the boiling point be represented in a…
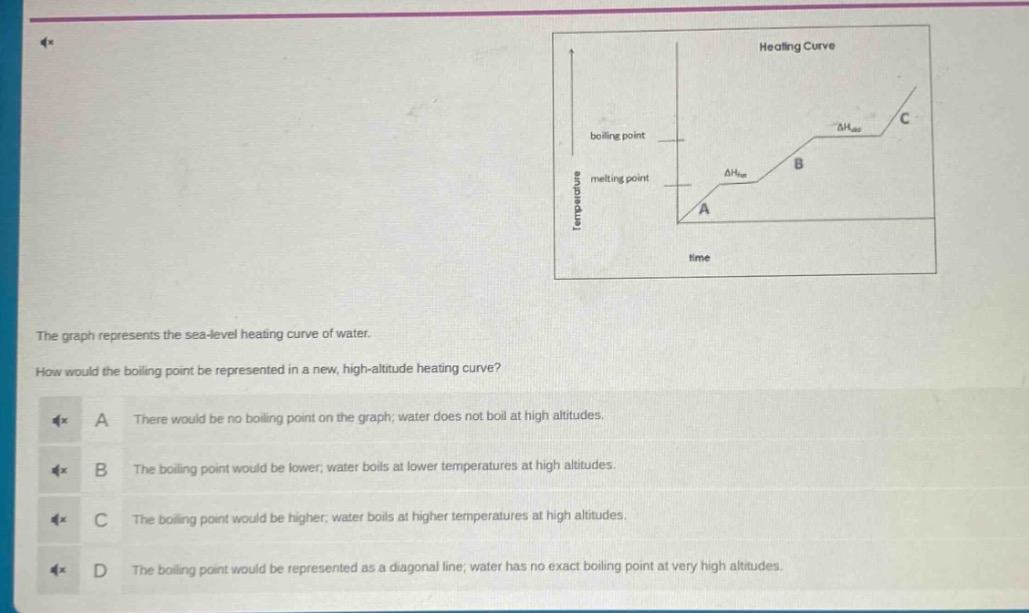
the graph represents the sea - level heating curve of water. how would the boiling point be represented in a new, high - altitude heating curve? a there would be no boiling point on the graph; water does not boil at high altitudes. b the boiling point would be lower; water boils at lower temperatures at high altitudes. c the boiling point would be higher; water boils at higher temperatures at high altitudes. d the boiling point would be represented as a diagonal line; water has no exact boiling point at very high altitudes.
Answer
Brief Explanation:
The boiling point of a liquid is the temperature at which its vapor - pressure equals the external pressure. At high altitudes, the atmospheric pressure is lower. According to the principles of thermodynamics, when the external pressure is lower, the temperature at which water's vapor - pressure equals this lower external pressure is also lower. So water boils at a lower temperature at high altitudes.
Answer:
B. The boiling point would be lower; water boils at lower temperatures at high altitudes.