the graph represents velocity over time. what is the acceleration? -0.4 m/s² -0.2 m/s² 0.2 m/s² 0.4 m/s²
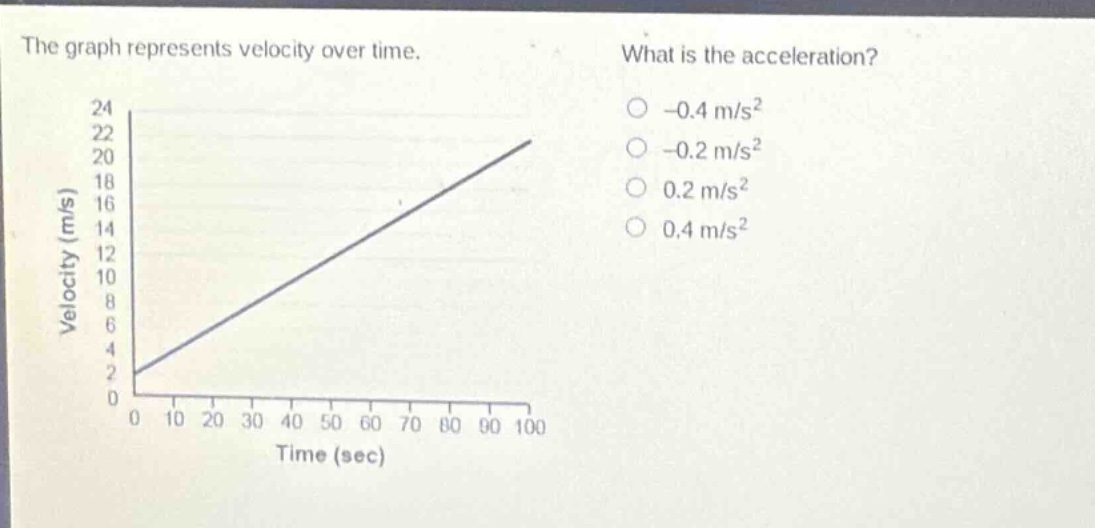
the graph represents velocity over time. what is the acceleration? -0.4 m/s² -0.2 m/s² 0.2 m/s² 0.4 m/s²
Answer
Explanation:
Step1: Recall acceleration formula
Acceleration $a=\frac{\Delta v}{\Delta t}$, where $\Delta v$ is change in velocity and $\Delta t$ is change in time.
Step2: Identify two - points on the graph
Let's take the initial point $(t_1, v_1)=(0,2)$ and the final point $(t_2, v_2)=(100,22)$.
Step3: Calculate $\Delta v$ and $\Delta t$
$\Delta v=v_2 - v_1=22 - 2=20$ m/s, $\Delta t=t_2 - t_1=100 - 0 = 100$ s.
Step4: Calculate acceleration
$a=\frac{\Delta v}{\Delta t}=\frac{20}{100}=0.2$ m/s².
Answer:
$0.2$ m/s²