the graph represents velocity vs. time for carla. which best describes the graph? carla sped up in the…
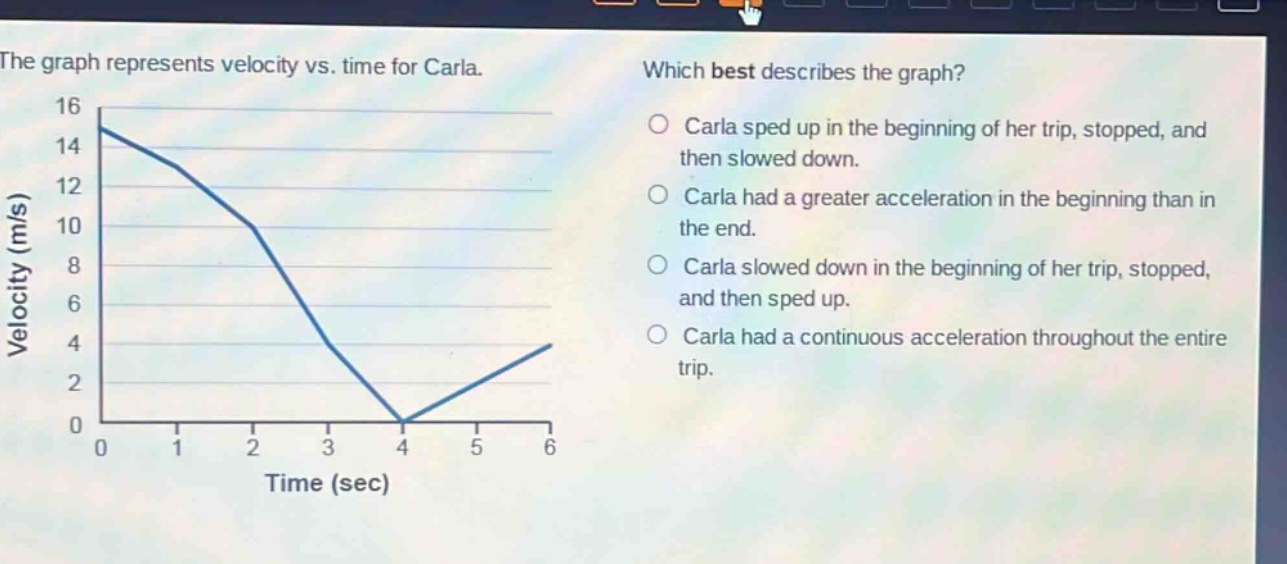
the graph represents velocity vs. time for carla. which best describes the graph? carla sped up in the beginning of her trip, stopped, and then slowed down. carla had a greater acceleration in the beginning than in the end. carla slowed down in the beginning of her trip, stopped, and then sped up. carla had a continuous acceleration throughout the entire trip.
Answer
Brief Explanations:
Analyze the velocity - time graph. At first, velocity decreases (slowing down). At time = 4 seconds, velocity is 0 (stopped). Then velocity increases (speeding up).
Answer:
Carla slowed down in the beginning of her trip, stopped, and then sped up.