the graph represents velocity vs. time for carla. which best describes the graph? o carla sped up in the…
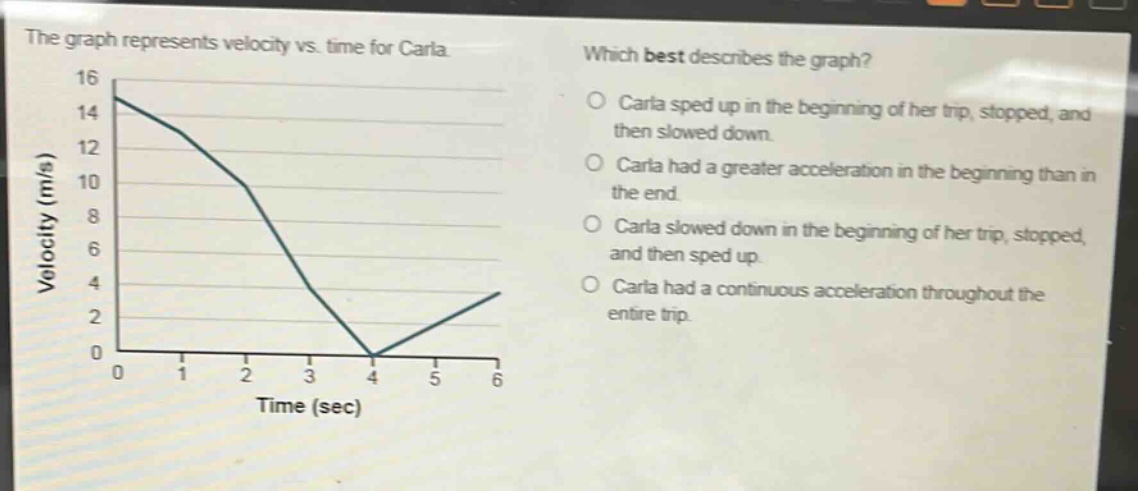
the graph represents velocity vs. time for carla. which best describes the graph? o carla sped up in the beginning of her trip, stopped, and then slowed down. o carla had a greater acceleration in the beginning than in the end. o carla slowed down in the beginning of her trip, stopped, and then sped up. o carla had a continuous acceleration throughout the entire trip.
Answer
Brief Explanations:
Analyze the velocity - time graph. At the start, velocity decreases (slows down), at (t = 4) sec velocity is 0 (stopped), and then velocity increases (speeds up).
Answer:
Carla slowed down in the beginning of her trip, stopped, and then sped up.