what does the graph show?\no the s and p waves travel the same distance through earths crust in the same…
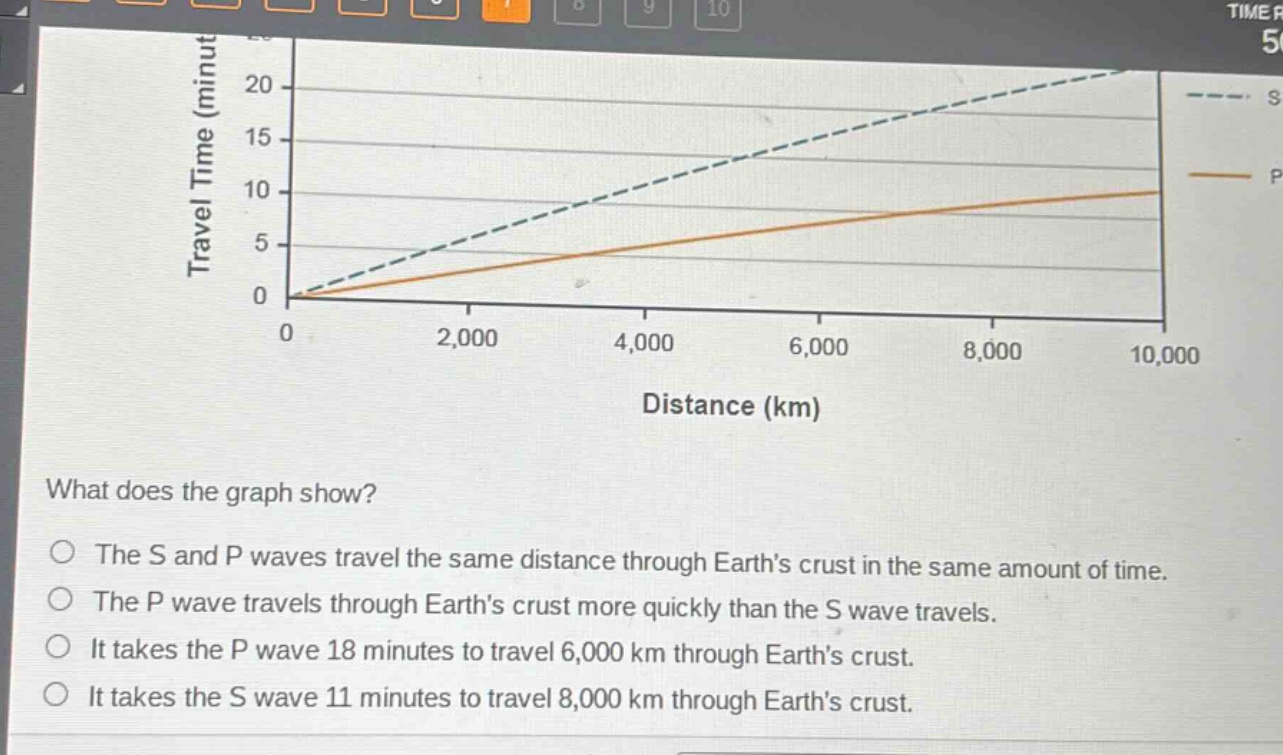
what does the graph show?\no the s and p waves travel the same distance through earths crust in the same amount of time.\no the p wave travels through earths crust more quickly than the s wave travels.\no it takes the p wave 18 minutes to travel 6,000 km through earths crust.\no it takes the s wave 11 minutes to travel 8,000 km through earths crust.
Answer
Brief Explanations:
- Analyze the graph: The x - axis represents distance in km and the y - axis represents travel time in minutes. The dashed line (S - wave) and the solid line (P - wave) are plotted.
- For any given distance, the P - wave has a lower travel time value on the y - axis compared to the S - wave. This indicates that P - waves travel faster through Earth's crust.
- Check each option:
- Option 1: The lines for S and P waves are different, so they do not travel the same distance in the same time.
- Option 2: Since for a given distance, the P - wave has a shorter travel time, it travels more quickly through Earth's crust than the S - wave.
- Option 3: From the graph, it takes the P - wave less than 10 minutes to travel 6000 km.
- Option 4: From the graph, it takes the S - wave more than 15 minutes to travel 8000 km.
Answer:
The P wave travels through Earth’s crust more quickly than the S wave travels.