the graph shows a heating curve for water. between which points on the graph would condensation occur? a…
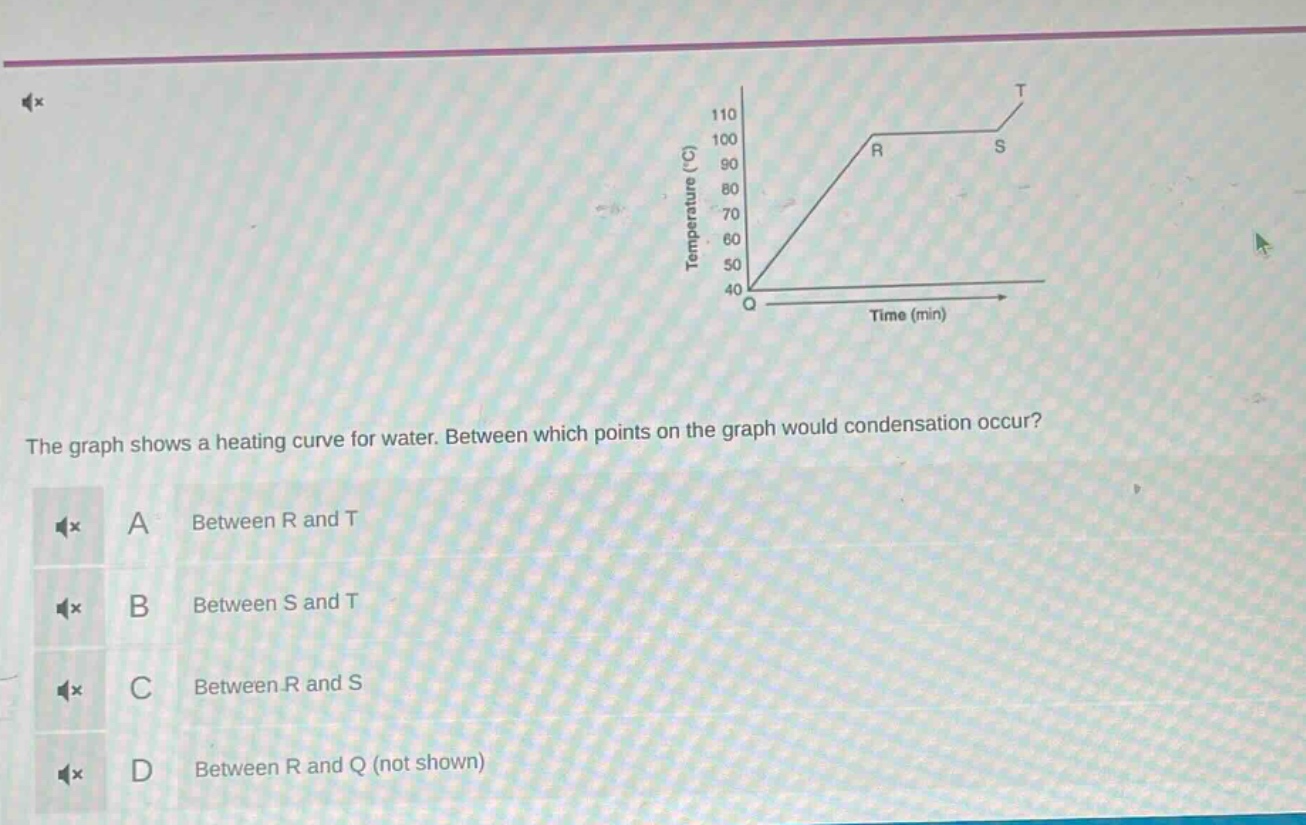
the graph shows a heating curve for water. between which points on the graph would condensation occur? a between r and t b between s and t c between r and s d between r and q (not shown)
Answer
Brief Explanations:
Condensation is the change from gas to liquid. On a heating - curve of water, the horizontal part represents a phase - change. Water is a gas above 100°C. As it cools, it condenses at 100°C. The horizontal section from S to T represents the cooling of steam (gas) to form liquid water at 100°C (condensation).
Answer:
B. Between S and T