the graph below shows y, the height (in feet) of a baseball, at time x (in seconds) after it was thrown. use…
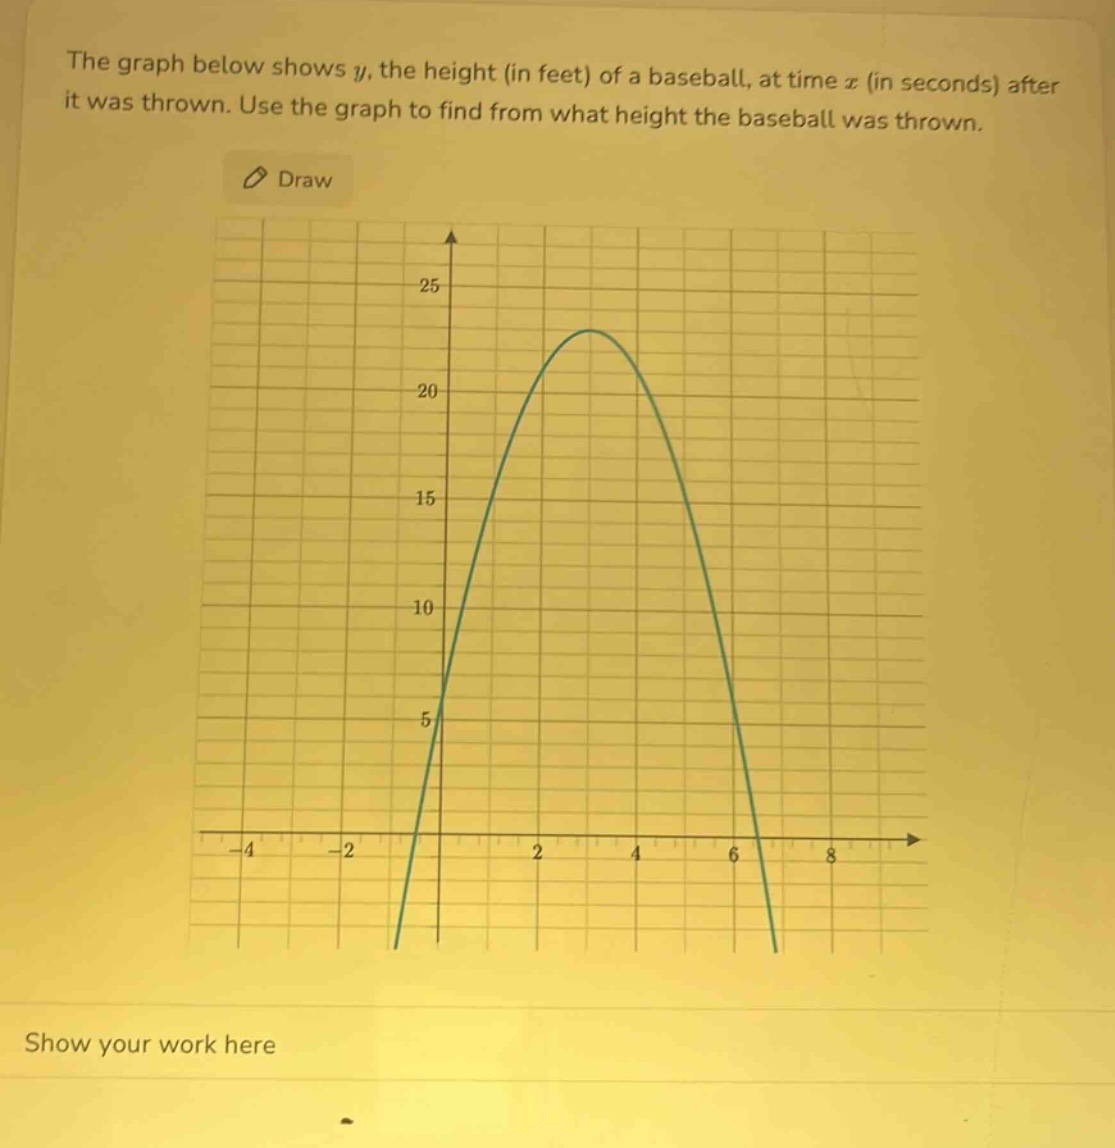
the graph below shows y, the height (in feet) of a baseball, at time x (in seconds) after it was thrown. use the graph to find from what height the baseball was thrown.
Answer
Explanation:
Step1: Identify the time of throw
The baseball is thrown at (x = 0) seconds.
Step2: Find the height at (x = 0)
On the graph, when (x=0), the value of (y) (height) is 5 feet.
Answer:
5 feet