the graph shows the increase in temperature over time in an oven. what is the change in the y - values and x…
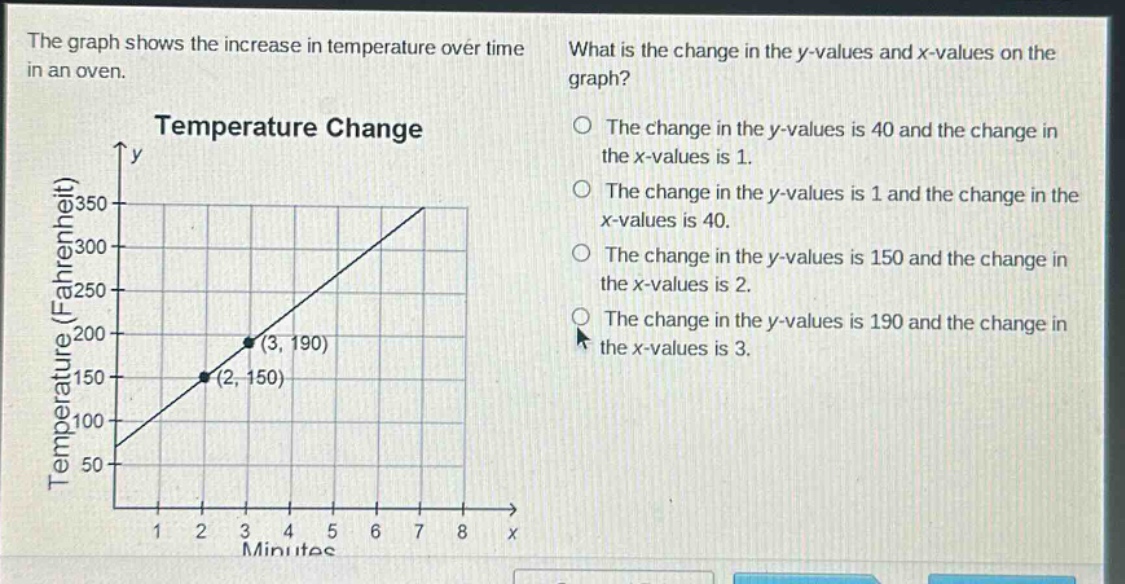
the graph shows the increase in temperature over time in an oven. what is the change in the y - values and x - values on the graph? temperature change the change in the y - values is 40 and the change in the x - values is 1. the change in the y - values is 1 and the change in the x - values is 40. the change in the y - values is 150 and the change in the x - values is 2. the change in the y - values is 190 and the change in the x - values is 3.
Answer
Explanation:
Step1: Identify two points
We have points $(2,150)$ and $(3,190)$.
Step2: Calculate change in y - values
The change in y - values $\Delta y=y_2 - y_1$. Here, $y_1 = 150$, $y_2=190$, so $\Delta y=190 - 150=40$.
Step3: Calculate change in x - values
The change in x - values $\Delta x=x_2 - x_1$. Here, $x_1 = 2$, $x_2 = 3$, so $\Delta x=3 - 2=1$.
Answer:
The change in the y - values is 40 and the change in the x - values is 1.