the graph shows the increase in temperature over time in an oven. temperature change what is the change in…
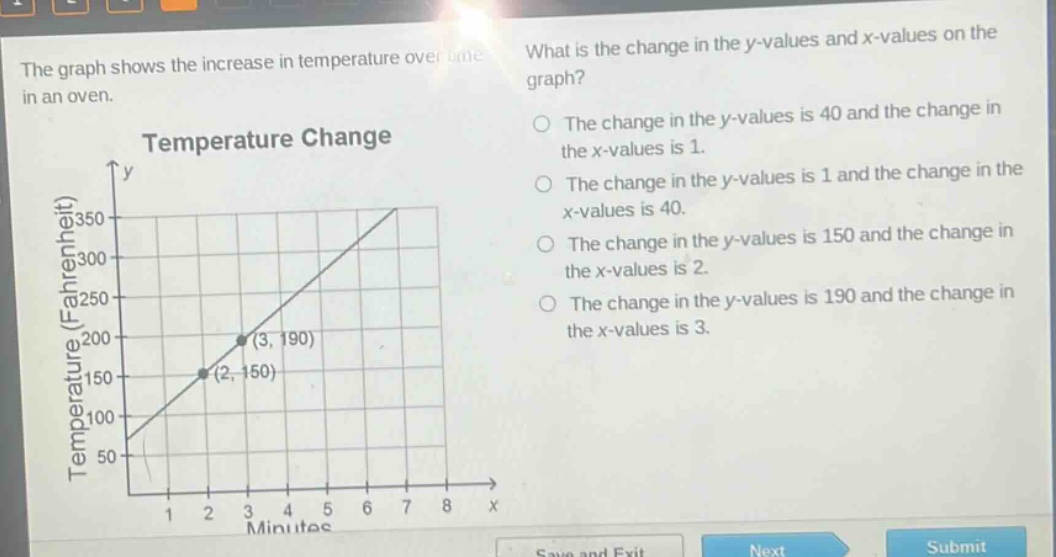
the graph shows the increase in temperature over time in an oven. temperature change what is the change in the y - values and x - values on the graph? the change in the y - values is 40 and the change in the x - values is 1. the change in the y - values is 1 and the change in the x - values is 40. the change in the y - values is 150 and the change in the x - values is 2. the change in the y - values is 190 and the change in the x - values is 3.
Answer
Answer:
The change in the y - values is 40 and the change in the x - values is 1.
Explanation:
Step1: Identificar puntos
Tomamos los puntos $(2,150)$ y $(3,190)$.
Step2: Calcular cambio en y
$\Delta y=y_2 - y_1=190 - 150 = 40$.
Step3: Calcular cambio en x
$\Delta x=x_2 - x_1=3 - 2 = 1$.