the graph shows the momentum y, in newton - seconds, of an object x seconds after the object started moving…
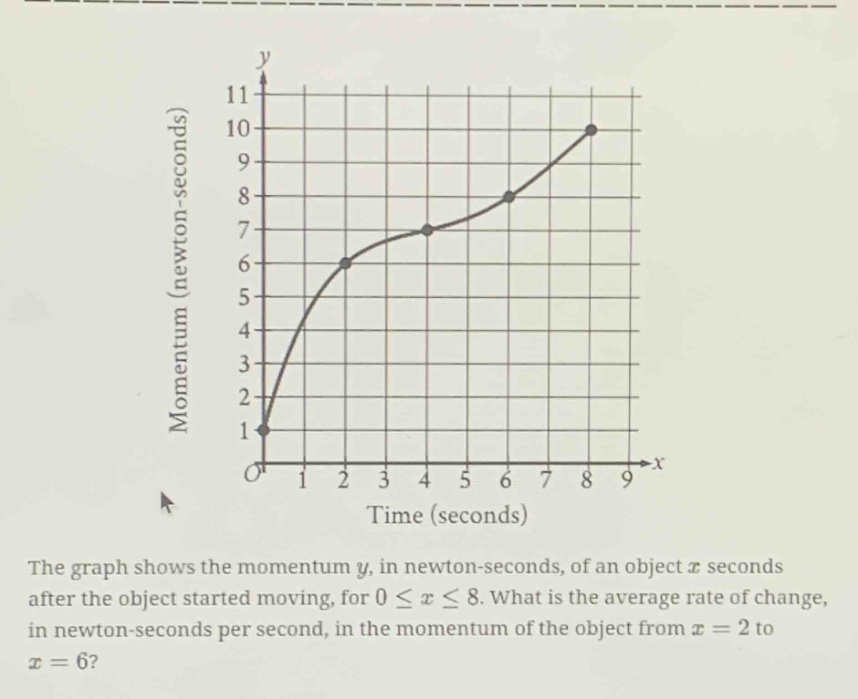
the graph shows the momentum y, in newton - seconds, of an object x seconds after the object started moving, for 0 ≤ x ≤ 8. what is the average rate of change, in newton - seconds per second, in the momentum of the object from x = 2 to x = 6?
Answer
Explanation:
Step1: Identify momentum at the start time.
Read the momentum value $y_1$ from the graph corresponding to the initial time $x_1 = 2$ seconds. $$ y_1 = 6 \text{ newton-seconds} $$
Step2: Identify momentum at the end time.
Read the momentum value $y_2$ from the graph corresponding to the final time $x_2 = 6$ seconds. $$ y_2 = 8 \text{ newton-seconds} $$
Step3: Calculate the change in momentum.
Find the difference between the final and initial momentum values ($\Delta y$). $$ \Delta y = y_2 - y_1 = 8 - 6 = 2 \text{ newton-seconds} $$
Step4: Calculate the change in time.
Find the difference between the final and initial time values ($\Delta x$). $$ \Delta x = x_2 - x_1 = 6 - 2 = 4 \text{ seconds} $$
Step5: Calculate the average rate of change.
Divide the change in momentum by the change in time. $$ \text{Average rate of change} = \frac{\Delta y}{\Delta x} = \frac{2}{4} = \frac{1}{2} \text{ newton-seconds per second} $$
Answer:
The average rate of change in the momentum of the object from $x=2$ to $x=6$ is $\frac{1}{2}$ newton-seconds per second.