the graph shows the motion of a car. which segments show that the car is accelerating? select three options…
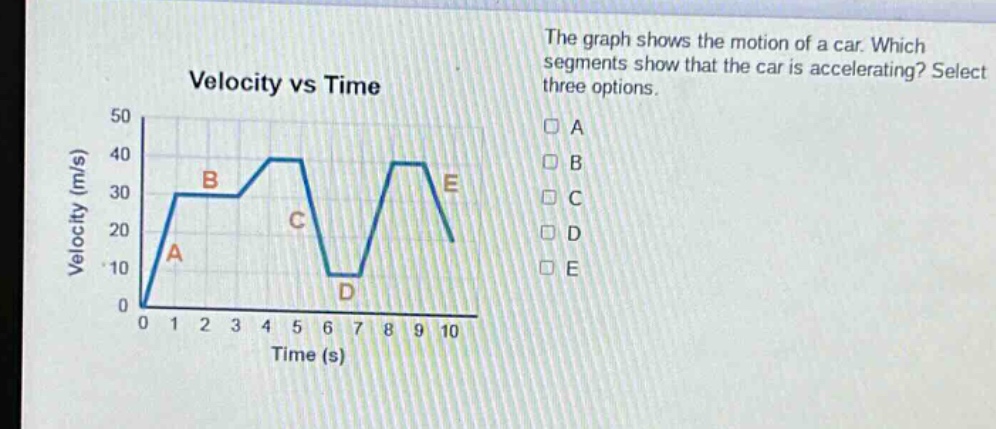
the graph shows the motion of a car. which segments show that the car is accelerating? select three options. a b c d e velocity vs time 0 1 2 3 4 5 6 7 8 9 10 time (s) 0 10 20 30 40 50 velocity (m/s) a b c d e
Answer
Explanation:
Step1: Recall acceleration - velocity relationship
Acceleration is the rate of change of velocity. On a velocity - time graph, non - zero acceleration is indicated by a non - horizontal slope.
Step2: Analyze each segment
Segment A: The velocity is increasing with time, so there is a positive slope and thus acceleration. Segment B: The velocity is constant, so the slope is zero and acceleration is zero. Segment C: The velocity is decreasing with time, so there is a negative slope and thus acceleration. Segment D: The velocity is constant, so the slope is zero and acceleration is zero. Segment E: The velocity is decreasing with time, so there is a negative slope and thus acceleration.
Answer:
A. Option A C. Option C E. Option E