which graph shows a negative acceleration? position (m) time (s) position (m) time (s)
which graph shows a negative acceleration? position (m) time (s) position (m) time (s)
Answer
Explanation:
Step1: Recall acceleration - position - time relationship
Acceleration is the second - derivative of position with respect to time. On a position - time graph, the slope of the graph gives velocity, and the change in slope gives acceleration.
Step2: Analyze the first graph
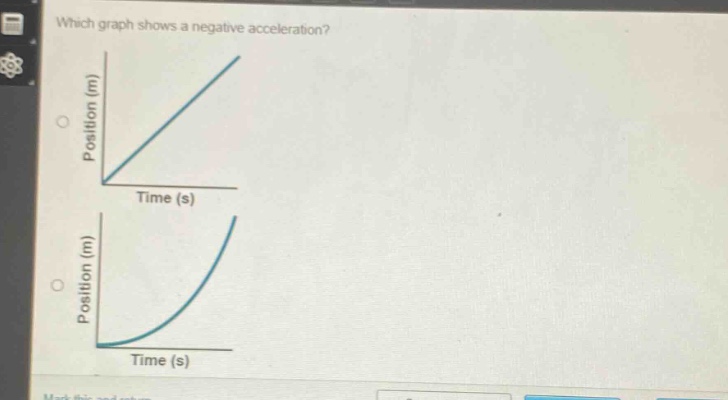
The first graph is a straight line. For a straight - line position - time graph, the slope is constant. So, the velocity is constant and the acceleration is zero ($a = 0$) since there is no change in velocity.
Step3: Analyze the second graph
The second graph is a curve that is becoming less steep as time increases. The slope of the position - time graph (which is velocity) is decreasing. A decrease in velocity over time means negative acceleration.