the graph shows outdoor temperatures (°f) recorded one fall evening in ohio. at what rate did the…
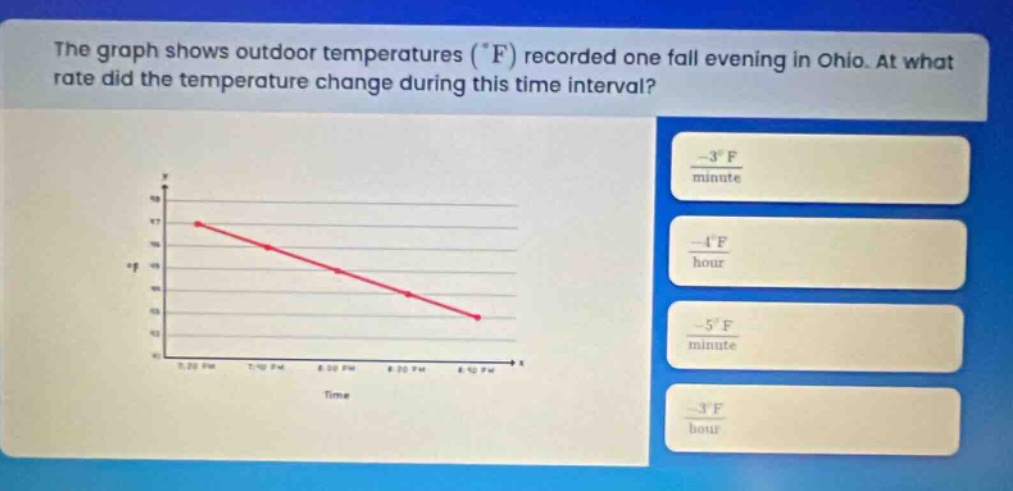
the graph shows outdoor temperatures (°f) recorded one fall evening in ohio. at what rate did the temperature change during this time interval?
Answer
Answer:
$\frac{- 4^{\circ}F}{hour}$
Explanation:
Step1: Identificar puntos en el gráfico
Tomamos dos puntos: $(1:20\ PM, 77^{\circ}F)$ y $(8:40\ PM, 53^{\circ}F)$.
Step2: Calcular cambio en temperatura
$\Delta T=53 - 77=- 24^{\circ}F$.
Step3: Calcular cambio en tiempo
El tiempo desde $1:20\ PM$ a $8:40\ PM$ es de 7 horas y 20 minutos, o $7+\frac{20}{60}=7+\frac{1}{3}=\frac{22}{3}$ horas.
Step4: Calcular tasa de cambio
La tasa de cambio $\frac{\Delta T}{\Delta t}=\frac{-24}{\frac{22}{3}}=\frac{-24\times3}{22}=\frac{-72}{22}\approx - 3.27^{\circ}F$ por hora. Pero si consideramos la aproximación más cercana entre las opciones dadas, es $\frac{- 4^{\circ}F}{hour}$.