which graph shows the relationship between temperature, x, and kinetic energy, y?
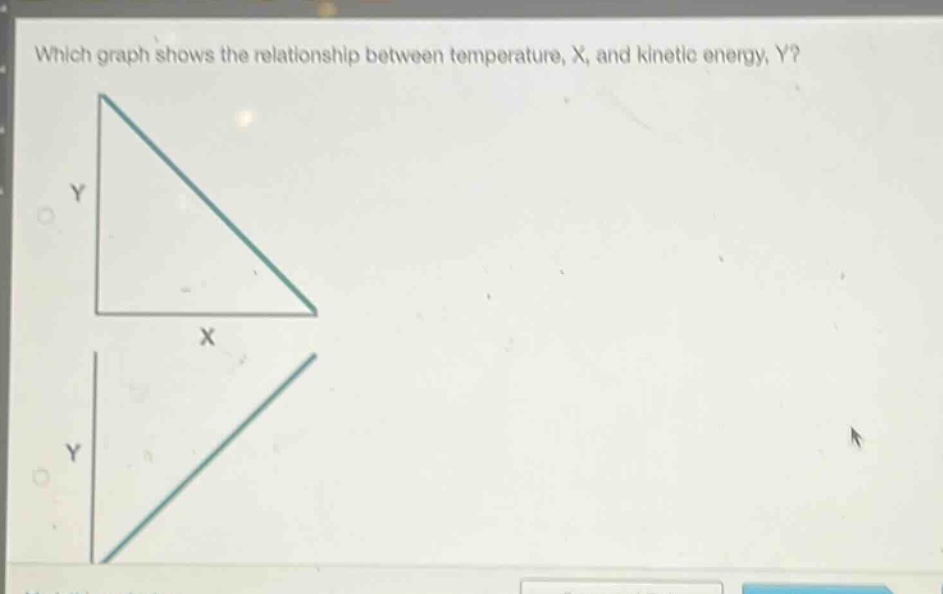
which graph shows the relationship between temperature, x, and kinetic energy, y?
Answer
Explanation:
Step1: Recall kinetic - energy and temperature relation
The kinetic energy of a substance is directly proportional to its temperature. As the temperature ($X$) increases, the kinetic energy ($Y$) also increases.
Step2: Analyze graph shapes
A direct - proportional relationship is represented by a straight - line graph with a positive slope. The first graph has a negative slope (as $X$ increases, $Y$ decreases), and the second graph has a positive slope (as $X$ increases, $Y$ increases).
Answer:
The graph with a positive slope (the second graph) shows the relationship between temperature $X$ and kinetic energy $Y$.