the graph shows the speed at which abdullah was riding his bike during his 60 - minute bike ride. speed…
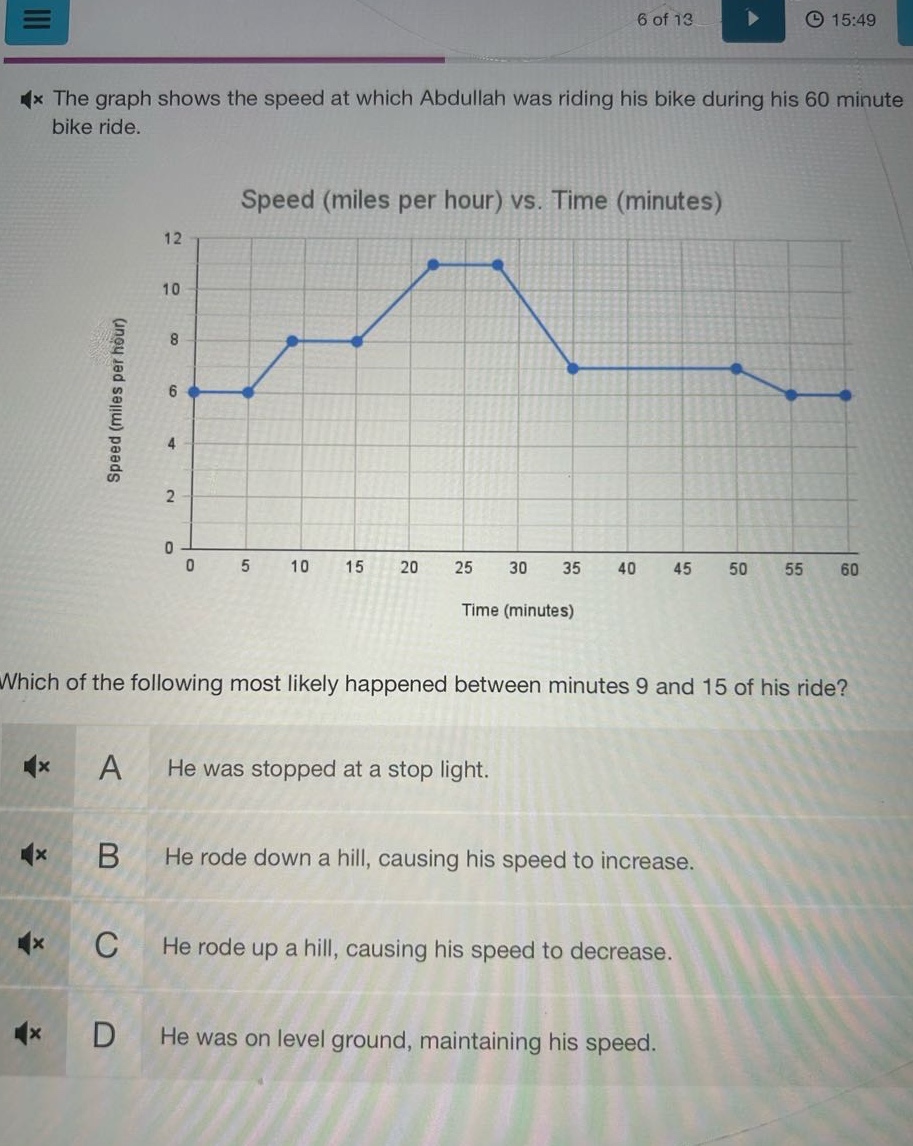
the graph shows the speed at which abdullah was riding his bike during his 60 - minute bike ride. speed (miles per hour) vs. time (minutes) which of the following most likely happened between minutes 9 and 15 of his ride? a he was stopped at a stop light. b he rode down a hill, causing his speed to increase. c he rode up a hill, causing his speed to decrease. d he was on level ground, maintaining his speed.
Answer
Brief Explanations:
Between minutes 9 and 15, the speed - time graph shows a horizontal line at 8 miles per hour. A horizontal line on a speed - time graph indicates that the speed is constant. When speed is constant, the object is moving at a steady rate without acceleration or deceleration. This is most likely to happen when the object is on level ground and maintaining its speed.
Answer:
D. He was on level ground, maintaining his speed.