the graph shows the speed of sams car over time. which best describes what is happening in section c? his…
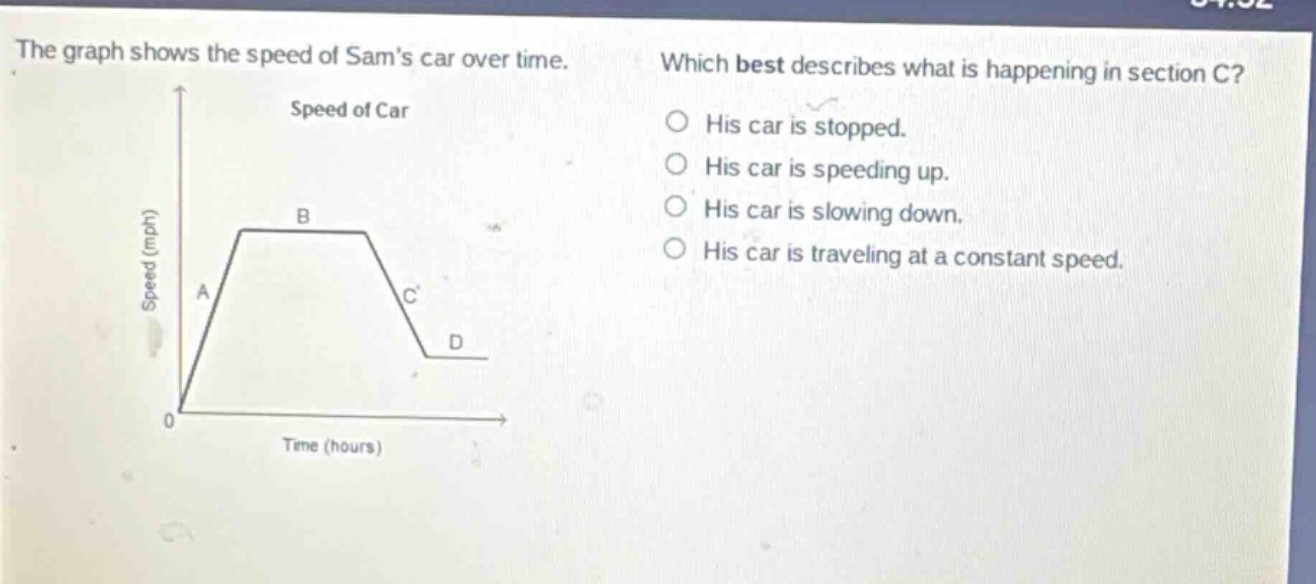
the graph shows the speed of sams car over time. which best describes what is happening in section c? his car is stopped. his car is speeding up. his car is slowing down. his car is traveling at a constant speed. speed of car speed (mph) b a c d 0 time (hours)
Answer
Answer:
His car is slowing down.
Explanation:
Step1: Analyze speed - time graph
In section C, the speed - value is decreasing as time increases.
Step2: Match with options
A decreasing speed means the car is slowing down.