the graphs display velocity data. velocity is on the y - axis (m/s), while time is on the x - axis (s)…
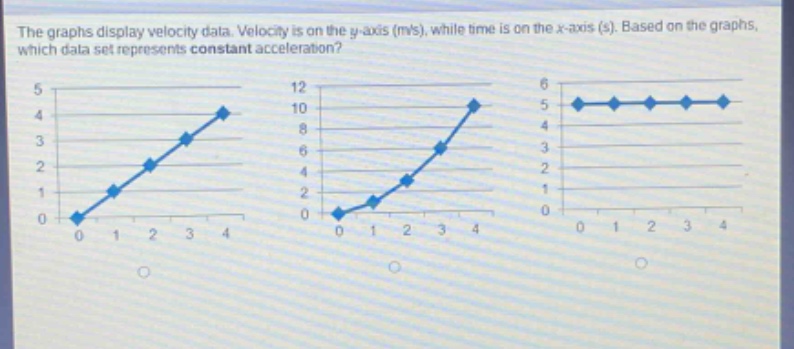
the graphs display velocity data. velocity is on the y - axis (m/s), while time is on the x - axis (s). based on the graphs, which data set represents constant acceleration?
Answer
Explanation:
Step1: Recall acceleration - velocity relationship
Acceleration is the rate of change of velocity. Constant acceleration means a constant - rate of change of velocity with respect to time. On a velocity - time graph, the slope represents acceleration.
Step2: Analyze the first graph
For the first graph, the velocity - time graph is a straight line. The slope of a straight - line graph is constant. The formula for slope $m=\frac{\Delta v}{\Delta t}$, and since the slope is constant, the acceleration $a = \frac{\Delta v}{\Delta t}$ is constant.
Step3: Analyze the second graph
The second graph is a curved line. The slope of a curved line is changing at different points. So, the acceleration (which is the slope of the velocity - time graph) is not constant.
Step4: Analyze the third graph
The third graph is a horizontal line. The slope of a horizontal line is 0. This represents zero acceleration (constant velocity), not non - zero constant acceleration.
Answer:
The first data set (the graph with a straight - line velocity - time relationship) represents constant acceleration.