identifying variables in a data table\nidentify which variable is plotted on each axis of a position vs time…
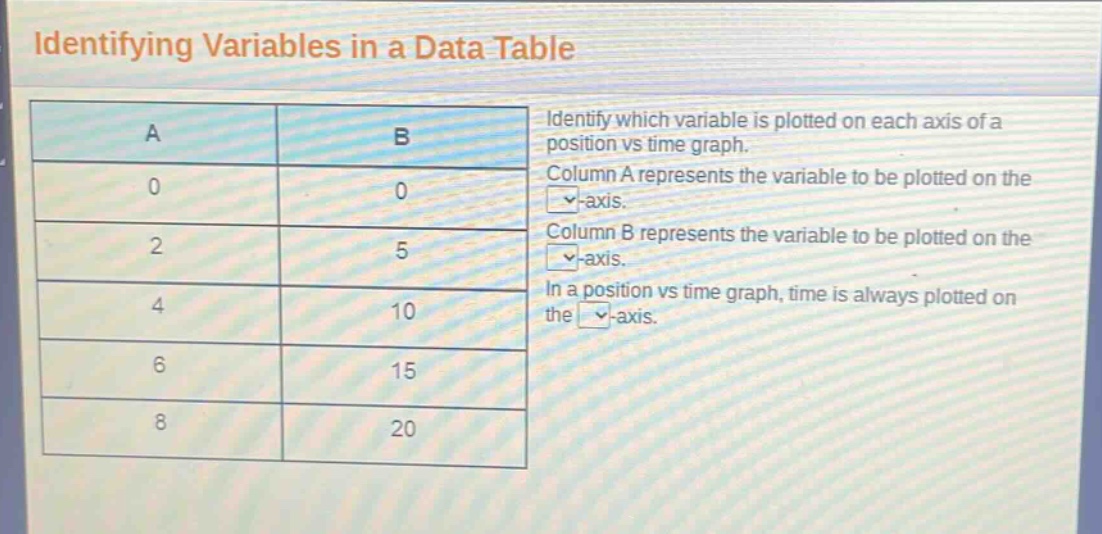
identifying variables in a data table\nidentify which variable is plotted on each axis of a position vs time graph.\ncolumn a represents the variable to be plotted on the -axis.\ncolumn b represents the variable to be plotted on the -axis.\nin a position vs time graph, time is always plotted on the -axis.
Answer
Answer:
Column A represents the variable to be plotted on the x - axis. Column B represents the variable to be plotted on the y - axis. In a position vs time graph, time is always plotted on the x - axis.
Explanation:
Step1: Recall graph - axis convention
In a position vs time graph, time is the independent variable and is plotted on the x - axis.
Step2: Analyze columns
Column A values seem to be evenly spaced (0, 2, 4, 6, 8), which is typical for a time - like variable. So it is the x - axis variable.
Step3: Determine other variable
Column B values (0, 5, 10, 15, 20) are likely positions corresponding to the time values in Column A, so it is the y - axis variable.