what is the interpretation of the amplitude in this application?\n the time between high tides\n the time…
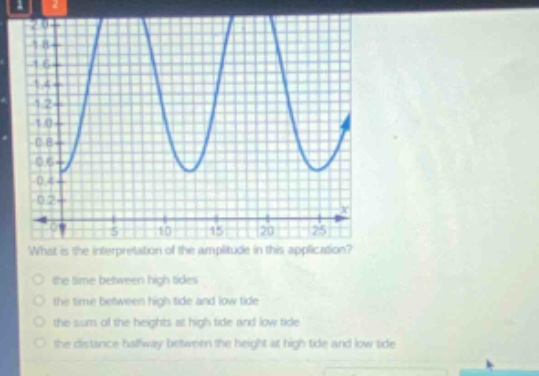
what is the interpretation of the amplitude in this application?\n the time between high tides\n the time between high tide and low tide\n the sum of the heights at high tide and low tide\n the distance halfway between the height at high tide and low tide
Answer
Explanation:
Step1: Identify Maximum and Minimum Heights
Observe the graph to find the highest point (high tide) and the lowest point (low tide). Maximum Height (High Tide) = $2.0$ Minimum Height (Low Tide) = $0.4$
Step2: Define Amplitude
Amplitude is half the difference between the maximum and minimum values of a periodic function. Amplitude = $\frac{\text{Maximum Height} - \text{Minimum Height}}{2}$
Step3: Calculate Amplitude
Substitute the values identified in Step 1 into the amplitude formula. Amplitude = $\frac{2.0 - 0.4}{2} = \frac{1.6}{2} = 0.8$
Step4: Interpret Amplitude
The amplitude represents the distance from the midline (average height) to the maximum or minimum height. It is half the total vertical distance between the high tide and low tide. Option D, "the distance halfway between the height at high tide and low tide," correctly describes this concept ($\frac{1}{2} \times (\text{High Tide Height} - \text{Low Tide Height})$).
Answer:
the distance halfway between the height at high tide and low tide