interpreting graphs for ke and mass\nwhich graph best represents the relationship between ke and…
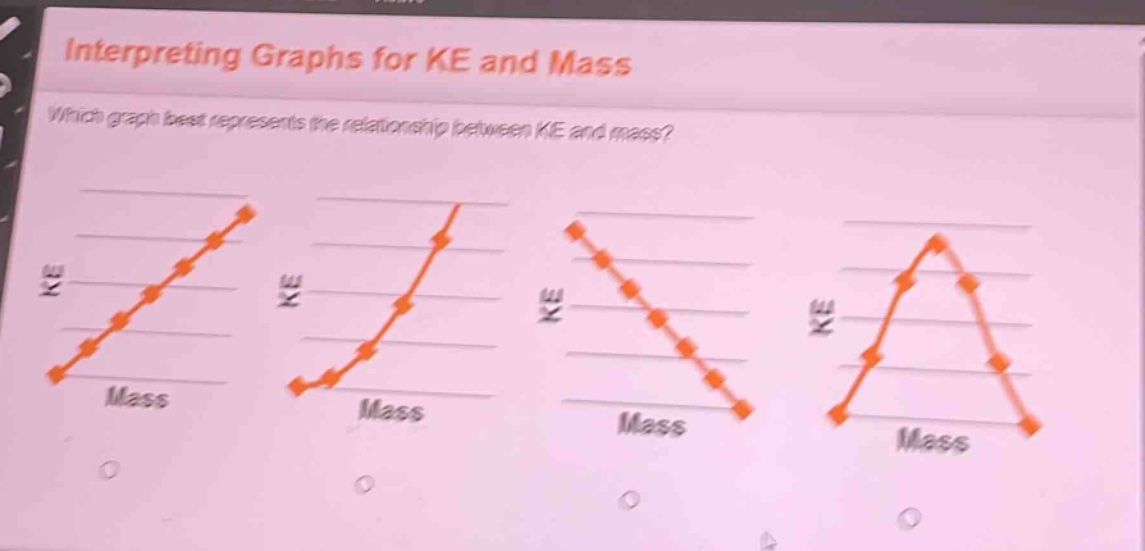
interpreting graphs for ke and mass\nwhich graph best represents the relationship between ke and mass?\nke\nmass\nke\nmass\nke\nmass\nke\nmass
Answer
Explanation:
Step1: Recall kinetic - energy formula
The formula for kinetic energy is $KE=\frac{1}{2}mv^{2}$, where $v$ is the velocity and $m$ is the mass. When the velocity $v$ is constant, $KE$ is directly proportional to the mass $m$ (since $\frac{1}{2}v^{2}$ is a constant in this case).
Step2: Identify the graph for direct - proportionality
A direct - proportional relationship between two variables $y$ and $x$ is represented by a straight - line graph passing through the origin ($y = kx$, where $k$ is a non - zero constant). In the case of $KE$ and $m$ with constant $v$, $KE$ is directly proportional to $m$, so the graph of $KE$ versus $m$ is a straight line passing through the origin.
Answer:
The first graph (the straight - line graph with a positive slope passing through the origin)