interpreting motion graphs: acceleration\nspeed as a function of time\nuse the graph of speed versus time to…
interpreting motion graphs: acceleration\nspeed as a function of time\nuse the graph of speed versus time to answer the questions about acceleration.\nwhich of the cars is speeding up?\nwhich of the cars is slowing down?\nwhich of the cars is maintaining a constant speed?
Answer
Explanation:
Step1: Analyze speed - time graph for speeding up
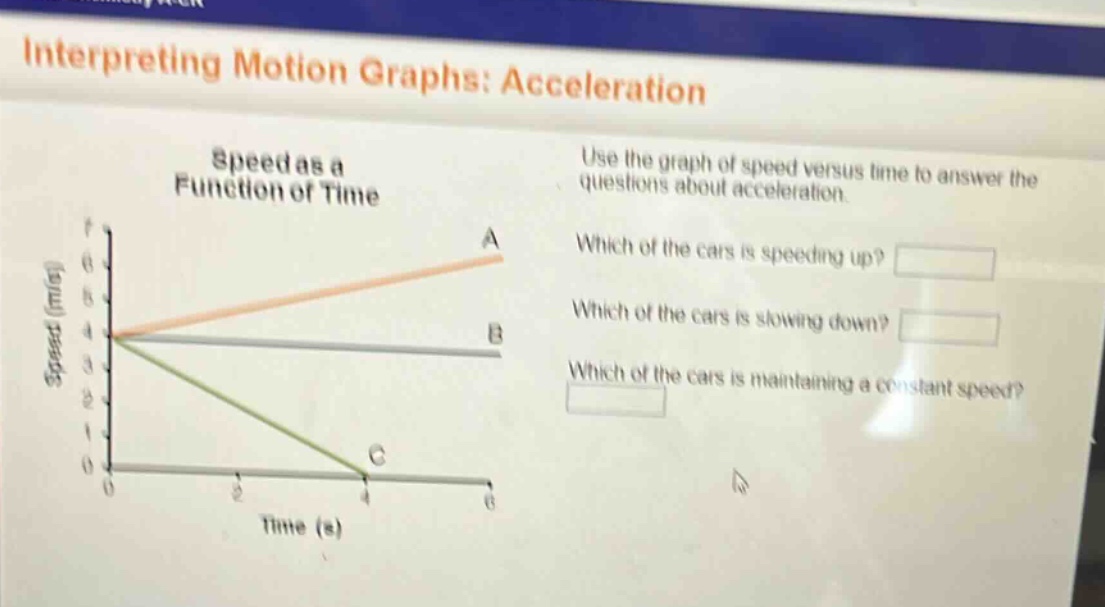
In a speed - time graph, a car is speeding up when the speed is increasing with time. For line A, as time increases from 0 to 6 seconds, the speed increases from 4 m/s to about 6 m/s. So car A is speeding up.
Step2: Analyze speed - time graph for slowing down
A car is slowing down when the speed is decreasing with time. For line C, as time increases from 0 to 4 seconds, the speed decreases from 4 m/s to 0 m/s. So car C is slowing down.
Step3: Analyze speed - time graph for constant speed
A car is maintaining a constant speed when the speed does not change with time. For line B, the speed remains at 4 m/s throughout the 6 - second time interval. So car B is maintaining a constant speed.
Answer:
Which of the cars is speeding up? A Which of the cars is slowing down? C Which of the cars is maintaining a constant speed? B