interpreting a position vs. time graph\nposition vs time\nusing the graph, describe what is happening…
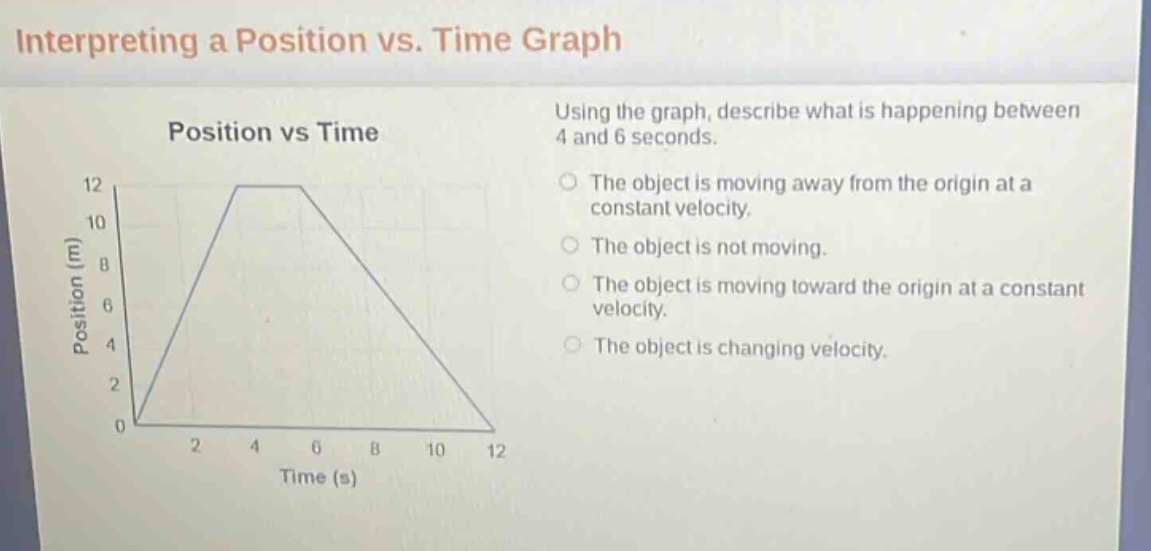
interpreting a position vs. time graph\nposition vs time\nusing the graph, describe what is happening between 4 and 6 seconds.\nthe object is moving away from the origin at a constant velocity.\nthe object is not moving.\nthe object is moving toward the origin at a constant velocity.\nthe object is changing velocity.
Answer
Answer:
The object is not moving.
Explanation:
Step1: Recall position - time graph concept
On a position - time graph, the slope represents velocity.
Step2: Analyze the graph segment
Between 4 and 6 seconds, the position - time graph is a horizontal line.
Step3: Determine the velocity
A horizontal line has a slope of 0. Since slope = velocity on a position - time graph, velocity is 0, meaning the object is not moving.