interpreting position vs time graphs\nposition vs time\nbased on the graph, describe what is happening…
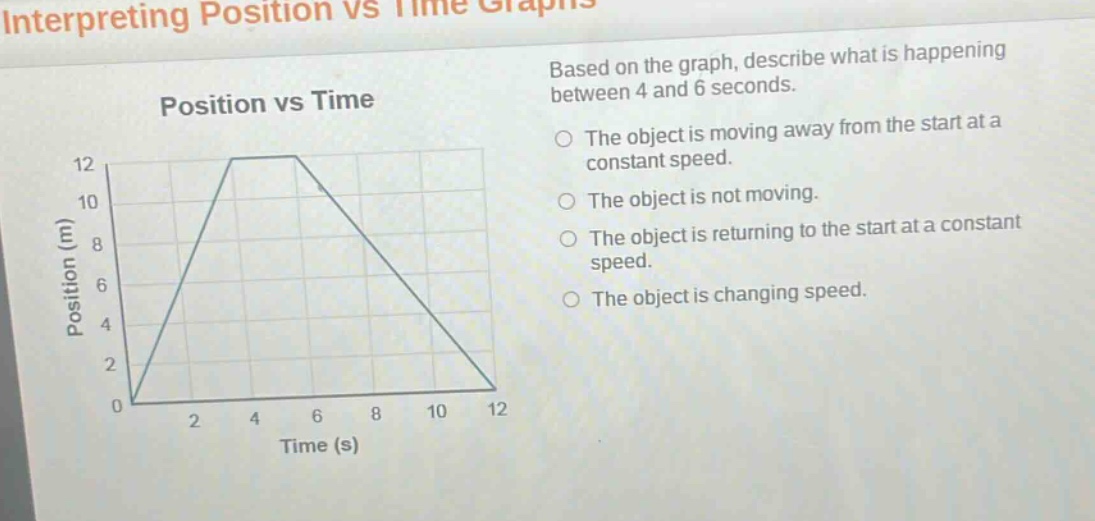
interpreting position vs time graphs\nposition vs time\nbased on the graph, describe what is happening between 4 and 6 seconds.\nthe object is moving away from the start at a constant speed.\nthe object is not moving.\nthe object is returning to the start at a constant speed.\nthe object is changing speed.
Answer
Brief Explanations:
In a position vs time graph, the slope represents velocity. Between 4 and 6 seconds, the graph is a horizontal line, indicating a slope of 0. A slope of 0 means velocity is 0, so the object's position does not change.
Answer:
The object is not moving.