jacob is the punter for his schools football team. during practice, he has the ball in his hand, ready to…
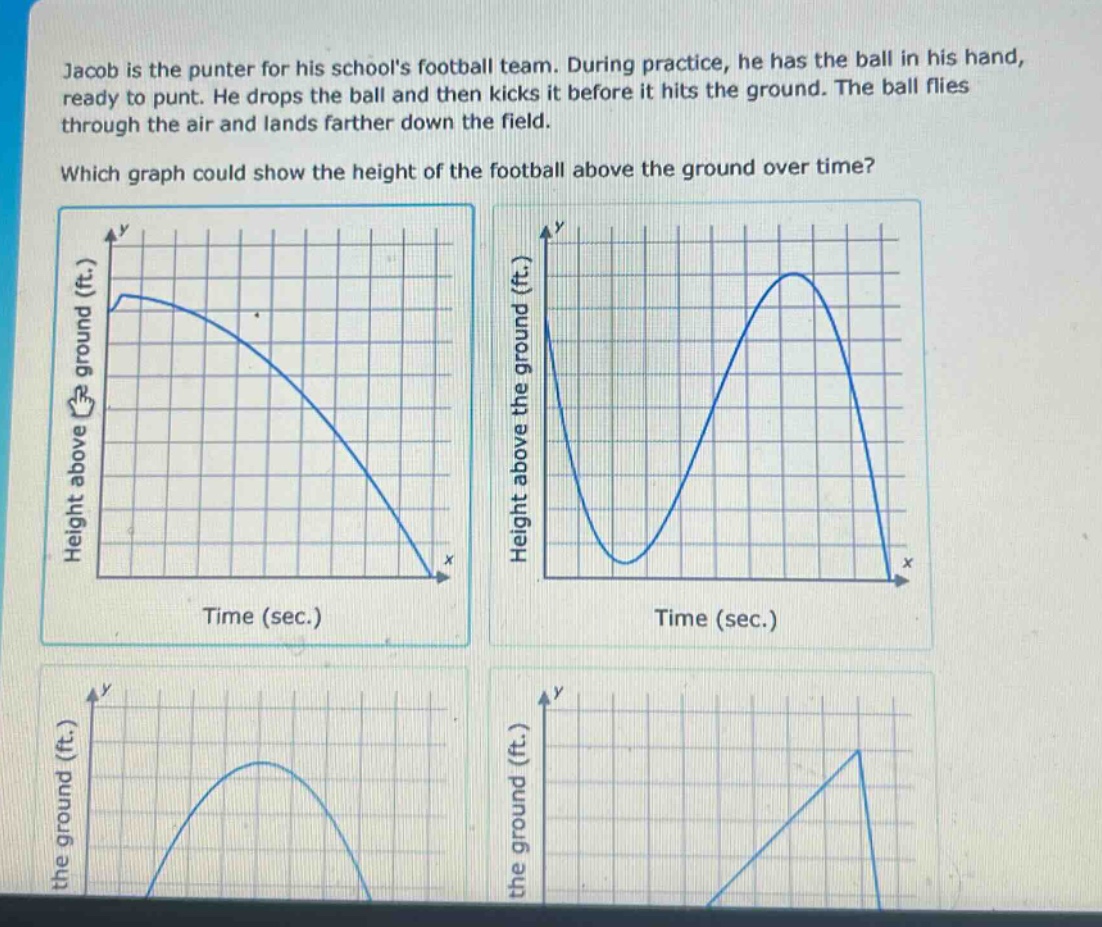
jacob is the punter for his schools football team. during practice, he has the ball in his hand, ready to punt. he drops the ball and then kicks it before it hits the ground. the ball flies through the air and lands farther down the field. which graph could show the height of the football above the ground over time?
Answer
Explanation:
Step1: Analyze ball - drop phase
When Jacob drops the ball, its height starts at a non - zero value and decreases until he kicks it.
Step2: Analyze ball - kick phase
When he kicks the ball, it gains upward velocity and its height increases, reaching a maximum, and then it falls back down due to gravity.
Step3: Match with graphs
The second graph shows a decrease in height (ball dropping), then an increase in height (ball being kicked and going up), reaching a peak and then decreasing again (ball falling back down).
Answer:
The second graph (the one with a decrease, then an increase to a peak and then a decrease)