kiera is participating in the egg toss at field day. she throws her egg to her partner, who catches it. her…
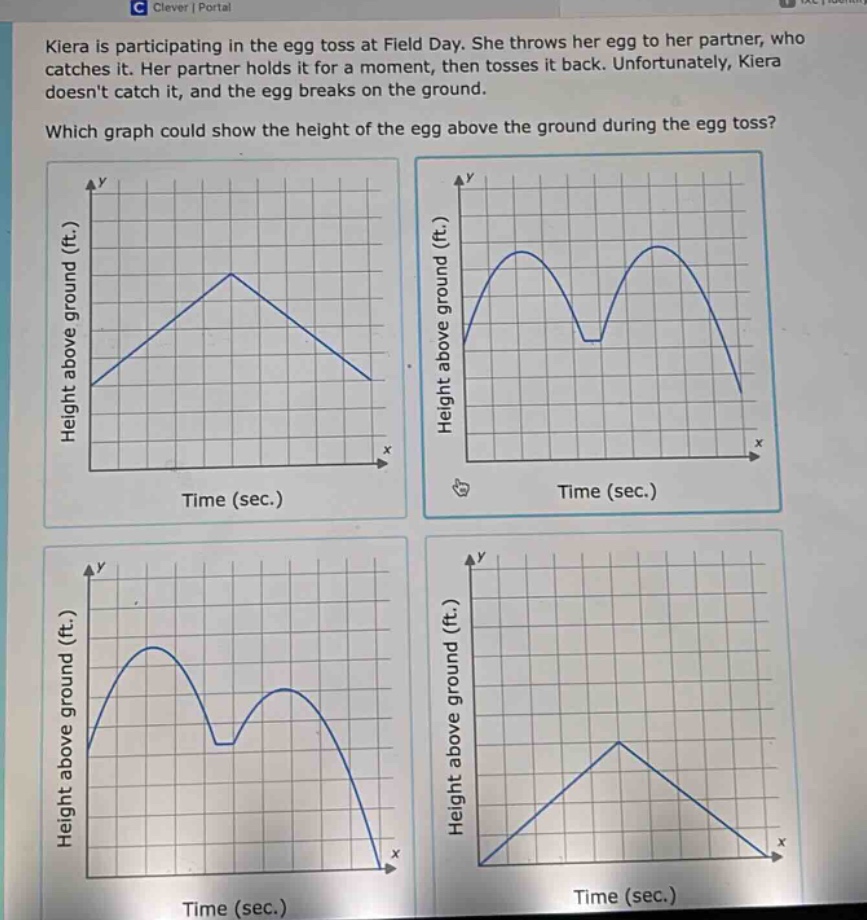
kiera is participating in the egg toss at field day. she throws her egg to her partner, who catches it. her partner holds it for a moment, then tosses it back. unfortunately, kiera doesnt catch it, and the egg breaks on the ground. which graph could show the height of the egg above the ground during the egg toss?
Answer
Answer:
The second graph (top - right)
Explanation:
Step1: Analyze the first throw
When Kiera throws the egg, its height first increases until it reaches a maximum point, forming an upward - then - downward curve.
Step2: Analyze the holding period
Her partner holds the egg for a moment. During this time, the height of the egg remains constant, which is shown as a horizontal line on the graph.
Step3: Analyze the second throw
Then her partner tosses it back. The height again increases and then decreases until Kiera doesn't catch it and the egg breaks on the ground (height reaches 0). The second graph shows these three distinct phases correctly: an upward - downward curve for the first throw, a horizontal line for the holding period, and another upward - downward curve for the second throw with the final height reaching 0.