lara made the table below of the predicted values for h(t), the height, in meters, of a penny t seconds…
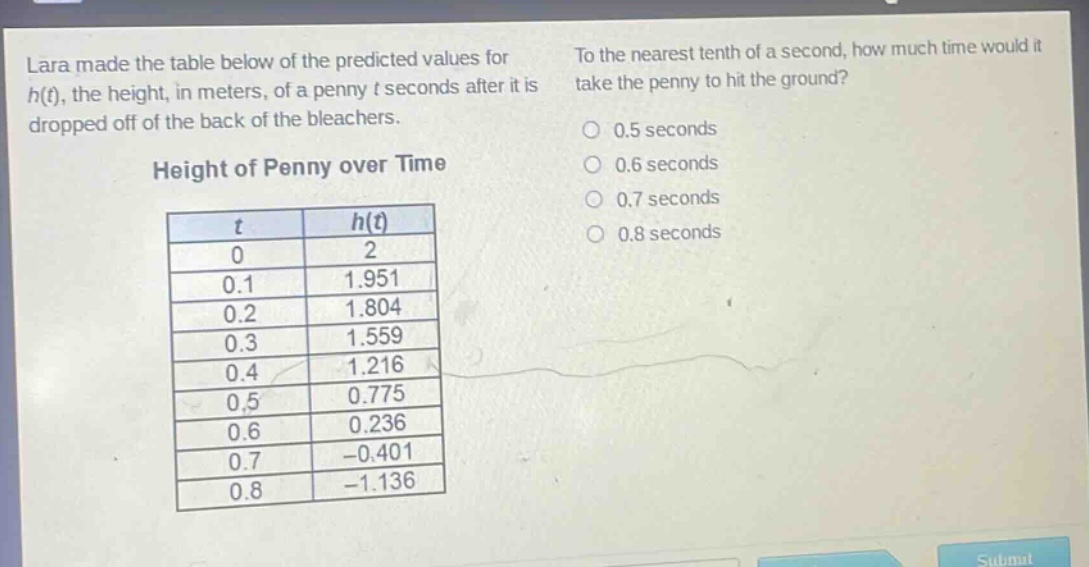
lara made the table below of the predicted values for h(t), the height, in meters, of a penny t seconds after it is dropped off of the back of the bleachers. to the nearest tenth of a second, how much time would it take the penny to hit the ground? height of penny over time t h(t) 0 2 0.1 1.951 0.2 1.804 0.3 1.559 0.4 1.216 0.5 0.775 0.6 0.236 0.7 -0.401 0.8 -1.136 0.5 seconds 0.6 seconds 0.7 seconds 0.8 seconds
Answer
Explanation:
Step1: Identify ground - hitting condition
The penny hits the ground when $h(t)=0$. We look at the table values to find when $h(t)$ changes sign from positive to negative.
Step2: Analyze table values
When $t = 0.6$, $h(0.6)=0.236$ (positive) and when $t = 0.7$, $h(0.7)= - 0.401$ (negative). So the value of $t$ for which $h(t) = 0$ is between $0.6$ and $0.7$. Since we want the value to the nearest tenth of a second, and the value crosses zero closer to $0.6$ than $0.7$.
Answer:
0.6 seconds