the lines on the position - time graph show the velocities of different vehicles. which line represents a…
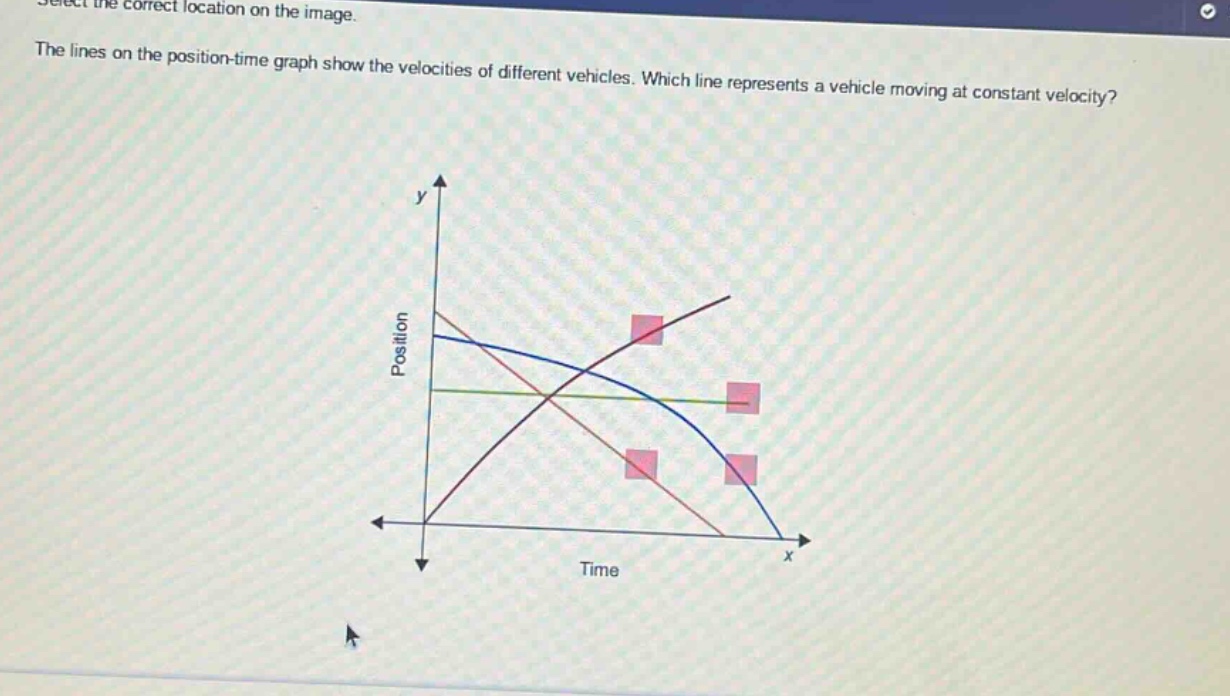
the lines on the position - time graph show the velocities of different vehicles. which line represents a vehicle moving at constant velocity?
Answer
Explanation:
Step1: Recall velocity - position - time relation
Velocity is the slope of the position - time graph.
Step2: Identify constant - slope line
A vehicle moving at constant velocity has a position - time graph with a straight - line (linear) shape because the slope (rate of change of position with respect to time) is constant. Curved lines represent non - constant velocities (acceleration or deceleration).
Answer:
The straight - line on the position - time graph represents a vehicle moving at constant velocity. (Since no specific line is labeled in the question, the general answer is that the straight - line is the one. If there were line labels like A, B, C etc., we would identify the straight - line among them).