luis created the graph below to show the temperature from 8:00 a.m. (8 hours after midnight) until 8:00 p.m…
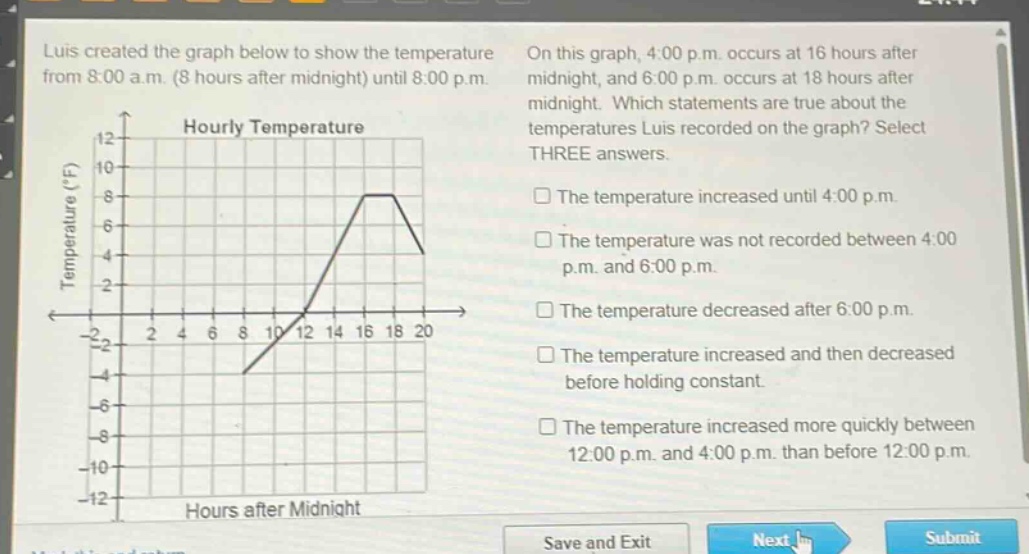
luis created the graph below to show the temperature from 8:00 a.m. (8 hours after midnight) until 8:00 p.m. on this graph, 4:00 p.m. occurs at 16 hours after midnight, and 6:00 p.m. occurs at 18 hours after midnight. which statements are true about the temperatures luis recorded on the graph? select three answers. hourly temperature the temperature increased until 4:00 p.m. the temperature was not recorded between 4:00 p.m. and 6:00 p.m. the temperature decreased after 6:00 p.m. the temperature increased and then decreased before holding constant. the temperature increased more quickly between 12:00 p.m. and 4:00 p.m. than before 12:00 p.m.
Answer
Answer:
- The temperature increased until 4:00 p.m.
- The temperature decreased after 6:00 p.m.
- The temperature increased more quickly between 12:00 p.m. and 4:00 p.m. than before 12:00 p.m.
Explanation:
Step1: Analyze temperature trend till 4:00 p.m.
From the graph, temperature rises from 8 a.m. (8 hours after midnight) to 4 p.m. (16 hours after midnight).
Step2: Analyze temperature trend after 6:00 p.m.
At 18 hours (6 p.m.), temperature starts to decline.
Step3: Compare rate of temperature increase
The slope of the line between 12 p.m. (12 hours after midnight) - 4 p.m. is steeper than before 12 p.m., indicating faster increase.