malik throws a ball up in the air. the graph below shows the height of the ball h in meters after t seconds…
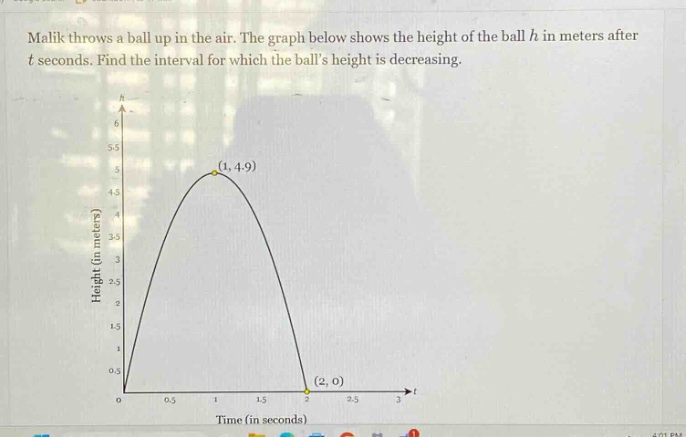
malik throws a ball up in the air. the graph below shows the height of the ball h in meters after t seconds. find the interval for which the balls height is decreasing.
Answer
Answer:
The ball's height is decreasing for the interval $1 < t<2$.
Explanation:
Step1: Analyze the graph
The graph shows height $h$ vs time $t$.
Step2: Identify the peak
The peak of the graph is at $(1,4.9)$.
Step3: Determine the decreasing - part
After the peak, the height of the ball decreases. This occurs for values of $t$ greater than 1 and less than 2.