the mass, q, of a sample of tritium (a radioactive isotope of hydrogen), decays at a rate of 5.626% per…
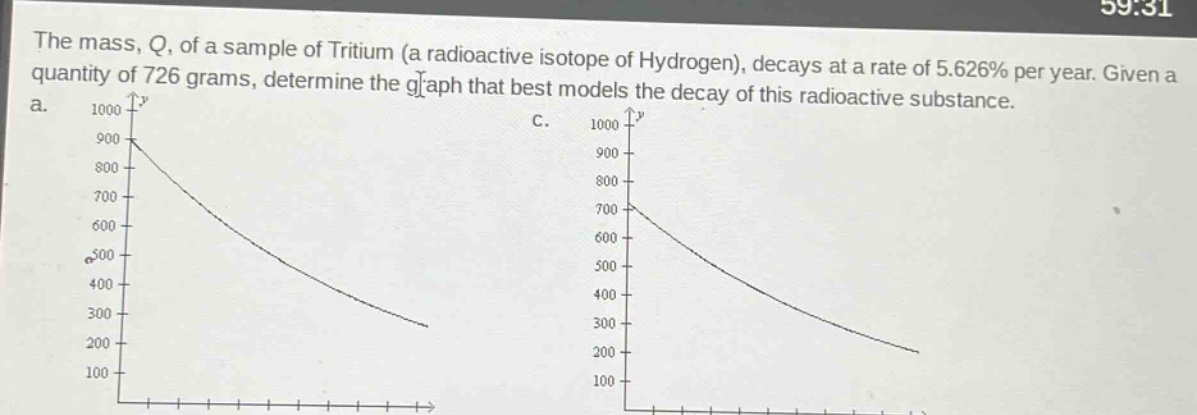
the mass, q, of a sample of tritium (a radioactive isotope of hydrogen), decays at a rate of 5.626% per year. given a quantity of 726 grams, determine the graph that best models the decay of this radioactive substance.
Answer
Explanation:
Step1: Identify decay - function form
The general form of exponential decay is $Q(t)=Q_0(1 - r)^t$, where $Q_0$ is the initial quantity, $r$ is the rate of decay, and $t$ is the time. Here, $Q_0 = 726$ grams and $r=0.05626$.
Step2: Analyze initial - value
At $t = 0$, $Q(0)=Q_0=726$ grams. So the graph should start at the point $(0,726)$.
Step3: Analyze decay behavior
Since it is a decay function, as $t$ increases, $Q(t)$ decreases. Also, the decay is exponential, so the graph is a curve that gets closer and closer to the $x$ - axis but never touches it.
Answer:
We need to check which of the given graphs starts at the point $(0,726)$ and shows exponential decay. Without seeing all the options, we know the graph should start at $y = 726$ when $x = 0$ and decrease exponentially. If one of the graphs has these characteristics (starts at $y=726$ on the $y$ - axis and has a decreasing exponential - like curve), that is the correct graph.