mitch did an experiment about evaporation for the school science fair. on saturday morning, he set a beaker…
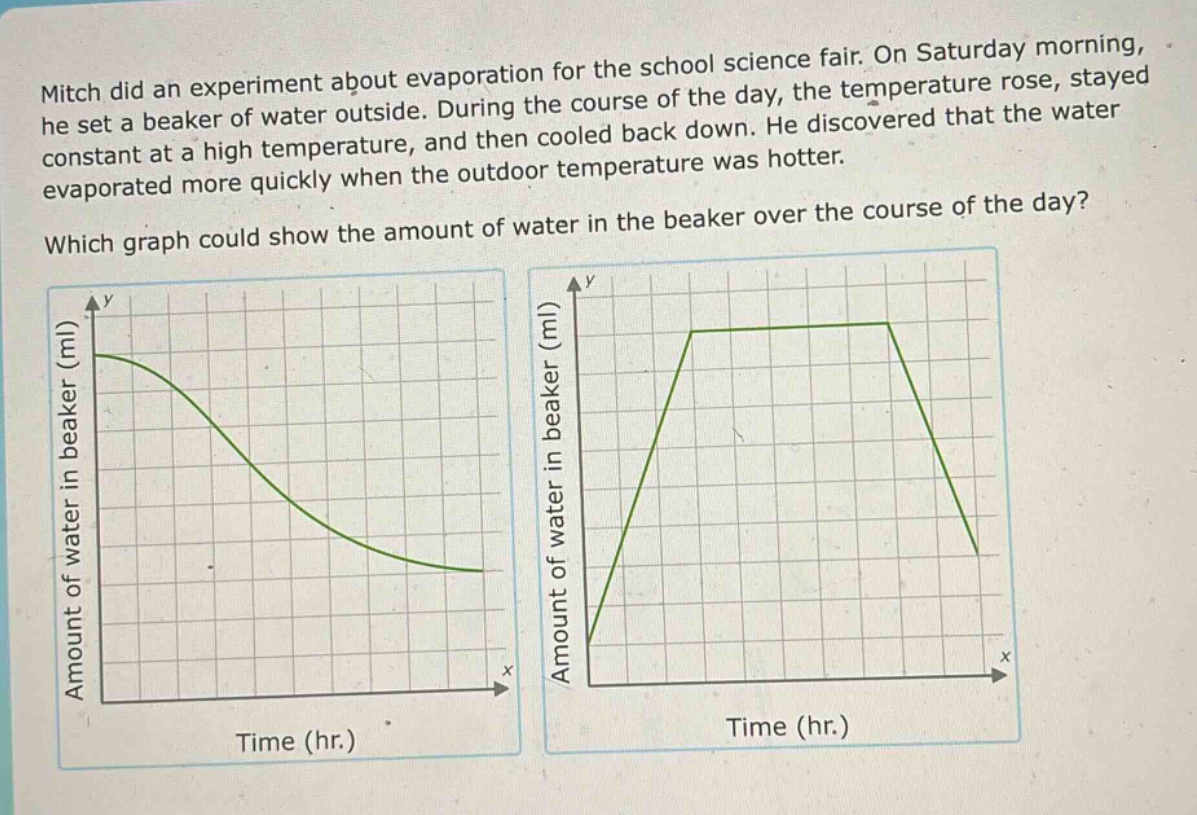
mitch did an experiment about evaporation for the school science fair. on saturday morning, he set a beaker of water outside. during the course of the day, the temperature rose, stayed constant at a high temperature, and then cooled back down. he discovered that the water evaporated more quickly when the outdoor temperature was hotter. which graph could show the amount of water in the beaker over the course of the day?
Answer
Answer: The graph on the left.
Explanation:
Step1: Analyze evaporation process
As time passes, water evaporates.
Step2: Consider temperature - evaporation relation
Higher temperature means faster evaporation.
Step3: Evaluate graphs
The left - hand graph shows a decreasing amount of water over time, which is consistent with evaporation. The right - hand graph shows an increase in water amount first, which is not in line with the evaporation experiment.